Matlab compiler usage
Prerequisites
UNIX/LINUX
You will need on your system at least :
- MATLAB
- the MATLAB Compiler Toolbox of the same version than the MATLAB one (=v4.10 if MATLAB is v4.10)
- a compatible version of gcc (>=4.0.0 for a MATLAB Compiler v4.10)
Other systems
We do not need to run it on other systems, and so we did not test it.
Building an executable
Here is describe how to build an stand-alone executable from MATLAB sources using the MATLAB Compiler toolbox.
Synopsis
To build the application, just use the MATLAB compiler command
mcc -mv <app>.m
Notes :
- For an application composed of multiple sources files, run the “mcc” command with the ONLY the main script as argument. The compiler will automatically detect and import all required dependencies.
- For running your build, you will need to have the same version of the mcc Compiler and of the MCR Runtime
Example
- Consider the following source :
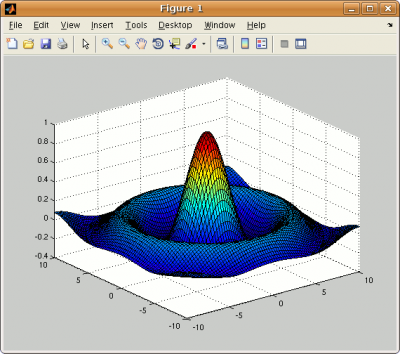
sinc_graphic.m
sz  = 10;
dsz = 0.25;

[ X, Y ] = meshgrid( -sz:dsz:sz, -sz:dsz:sz );
R = sqrt( X.^2 + Y.^2 );
Z = sin ( R ) ./ R;

% Display the result of the cardinal sine as a Surface Plot
surf ( X,Y,Z );
- To build the application, use the command
mcc -mv sinc_graphic.m
- This will produce the files :
mccExcludedFiles.log
sinc_graphic_main.c
sinc_graphic_mcc_component_data.c
sinc_graphic.prj
readme.txt
run_sinc_graphic.sh
sinc_graphic
Only the 2 last ones are requested for the deployment. However, the readme.txt contains useful informations on how to run the application previously built.
Deployment
For running the build, you first need to install the “Matlab Compiler Runtime” environment (MCR). This application will be able to execute your build.
Matlab Compiler Runtime Installation
- Locate the file “MCRInstaller.bin” which is situed in the MATLAB Compiler Toolbox directory.
- Execute it. During the installation, it will be asked you to choose a target directory. In the following, we will call it ${MCR_ROOT}.
Application Installation
In the installation directory, just copy the files created during the build process :
readme.txt
run_<app>.sh
<app>
where :
<app> is the name of your main script, with the “.m” extension omitted
Example
On the Icare’s system, we proceed this way :
- MATLAB has been installed in /usr/local/matlab, the toolbox directory is /usr/local/matlab/toolbox/ and the compiler one is in /usr/local/matlab/toolbox/compiler
- So the Runtime Installer is situed in /usr/local/matlab/toolbox/compiler/deploy/glnx86/MCRInstaller.bin
- It has been installed in ${HOME}/lib/MATLAB_Compiler_Runtime. This is our ${MCR_ROOT}.
- The “sinc_graphic” application above has been deployed in ${HOME}/test by filling it with the files :
run_sinc_graphic.sh
sinc_graphic
Execution
Synopsis
Finally, to run the application,
- Go in the installation directory,
- Run the “.sh” file by typing
./run_<app>.sh ${MCR_ROOT}/<vXXX> <args>
where :
<app> is the name of your main script, with the “.m” extension omitted
<args> are the usual command line arguments
<vXXX> is the version of the compiler runtime to use
Example
- Go in the directory ${HOME}/test
cd ${HOME}/test - Launch the application
./run_sinc_graphic.sh ${MCR_ROOT}/v710/ - You should obtain the widget
Surface Plot of a Cardinal Sine