AIRS-LMD
The Atmospheric Infrared Sounder
AIRS-LMD Cloud Climatology at ICARE
In collaboration with the IPSL/LMD/ABC(t)/ARA group, ICARE converted the Level-2 AIRS-LMD cloud climate data records into netCDF format to facilitate data analysis and visualization as global maps. ICARE archives and distributes these AIRS-LMD Level-2 cloud data to the public.
Retrieved cloud properties are amount, pressure, altitude, temperature and emissivity as well as cloud type (from cloud pressure and emissivity). Products are provided for the period 2003-2009, separately for observations at 1:30 PM (ascending phase of orbit, i.e. daytime) and at 1:30 AM (descending phase of orbit, i.e. nighttime).
AIRS-LMD Cloud Climatology
The Atmospheric Infrared Sounder (AIRS) is one of the six instruments flying onboard NASA’s Aqua satellite, launched in May 2002. The instrument was designed by NASA to support climate research and improve weather forecasting.
The Atmospheric Radiation Analysis (ARA) group at IPSL/LMD generated a multi-year global climatology of cloud properties using AIRS observations from 2003 to 2009. The data sets, retrieval method and evaluation with CALIPSO/CALIOP and CloudSat/CPR data are described in the reference paper by Stubenrauch et al., 2010. This AIRS-LMD cloud climatology participated in the GEWEX cloud assessment (Stubenrauch et al., 2013) as a climatology derived from the new generation of NASA instruments in the A-Train constellation of sensors.
In 2018, an improved and extended AIRS-LMD cloud climatology (2003-2016) is foreseen to be distributed by the French AERIS/ICARE Data and Services Center (Stubenrauch et al., 2017).
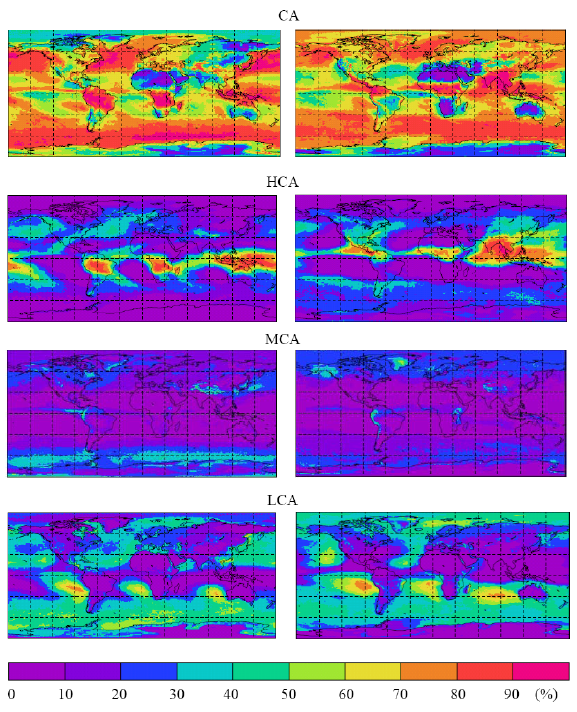
Left: Geographical maps of total, high, mid-level and low-level cloud amount from AIRS-LMD, in January (left) and in July (right). Averages over the period from 2003 to 2008 (Fig. 6 from Stubenrauch et al., 2010)
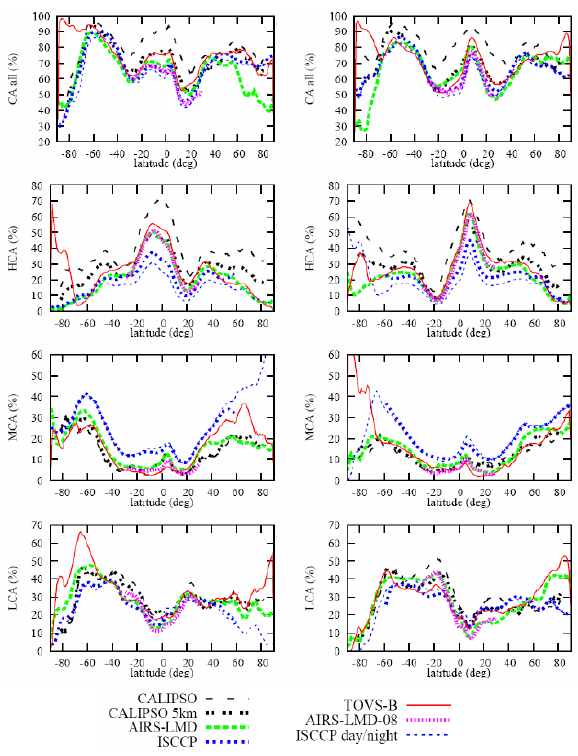
Right: Zonal averages of total, high, mid-level and low-level cloud amount from AIRS-LMD compared to results from various cloud climatologies, in January (left) and in July (right) (Fig. 7 from Stubenrauch et al., 2010)


