Access
The portal is accessible at the following URL: https://volcplume.aeris-data.fr
- Use AERIS credentials or alternative authentication providers
- Once logged in, authentication is no longer
required for subsequent access - In case of access issues, please contact icare-contact@univ-lille.fr
We recommend:
- using a recent computer with a good internet access
- updating your browser to the most recent version to ensure the best experience
Select and load your data
Selection widgets
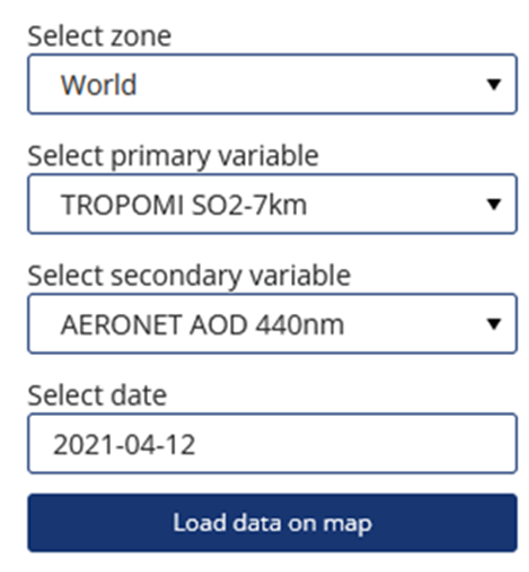
→ Choose global scale or a pre-determined zone, or provide lat/lon extents for a custom region
→ Choose primary variable. NB: for geostationary data, satellite will be inferred based on selected zone, or explicitly chosen by user if global scale is selected
→ Select secondary variable
→ Select date (only those for which currently selected primary data is available are listed)
→ Click to send data retrieval request (may take up to 20 seconds for some requests)
« Primary variable » products: LEO/GEO satellites & ECMWF/ERA5
Sentinel-5P/TROPOMI
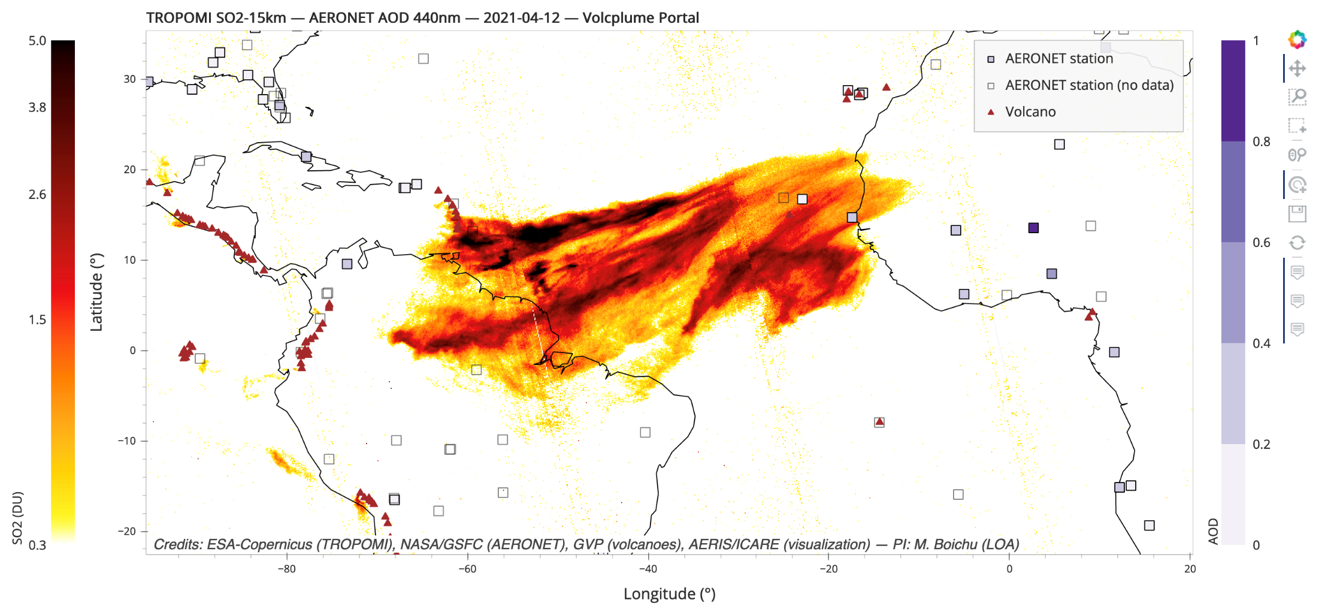
- TROPOMI SO2-{n}km: sulfurdioxide_total_vertical_column_{n}km dataset in S5P L2 SO2 product (assumed altitude 1, 7 or 15 km), vertical slider to explore the different levels
- TROPOMI Cloud Fraction: cloud_fraction dataset in S5P L2 CLOUD product
- TROPOMI Aerosol Index: aerosol_index_340_380 dataset in S5P L2 AER_AI product
- TROPOMI Aerosol Layer Height: aerosol_mid_height dataset in S5P L2 AER_LH product
MetOp/IASI
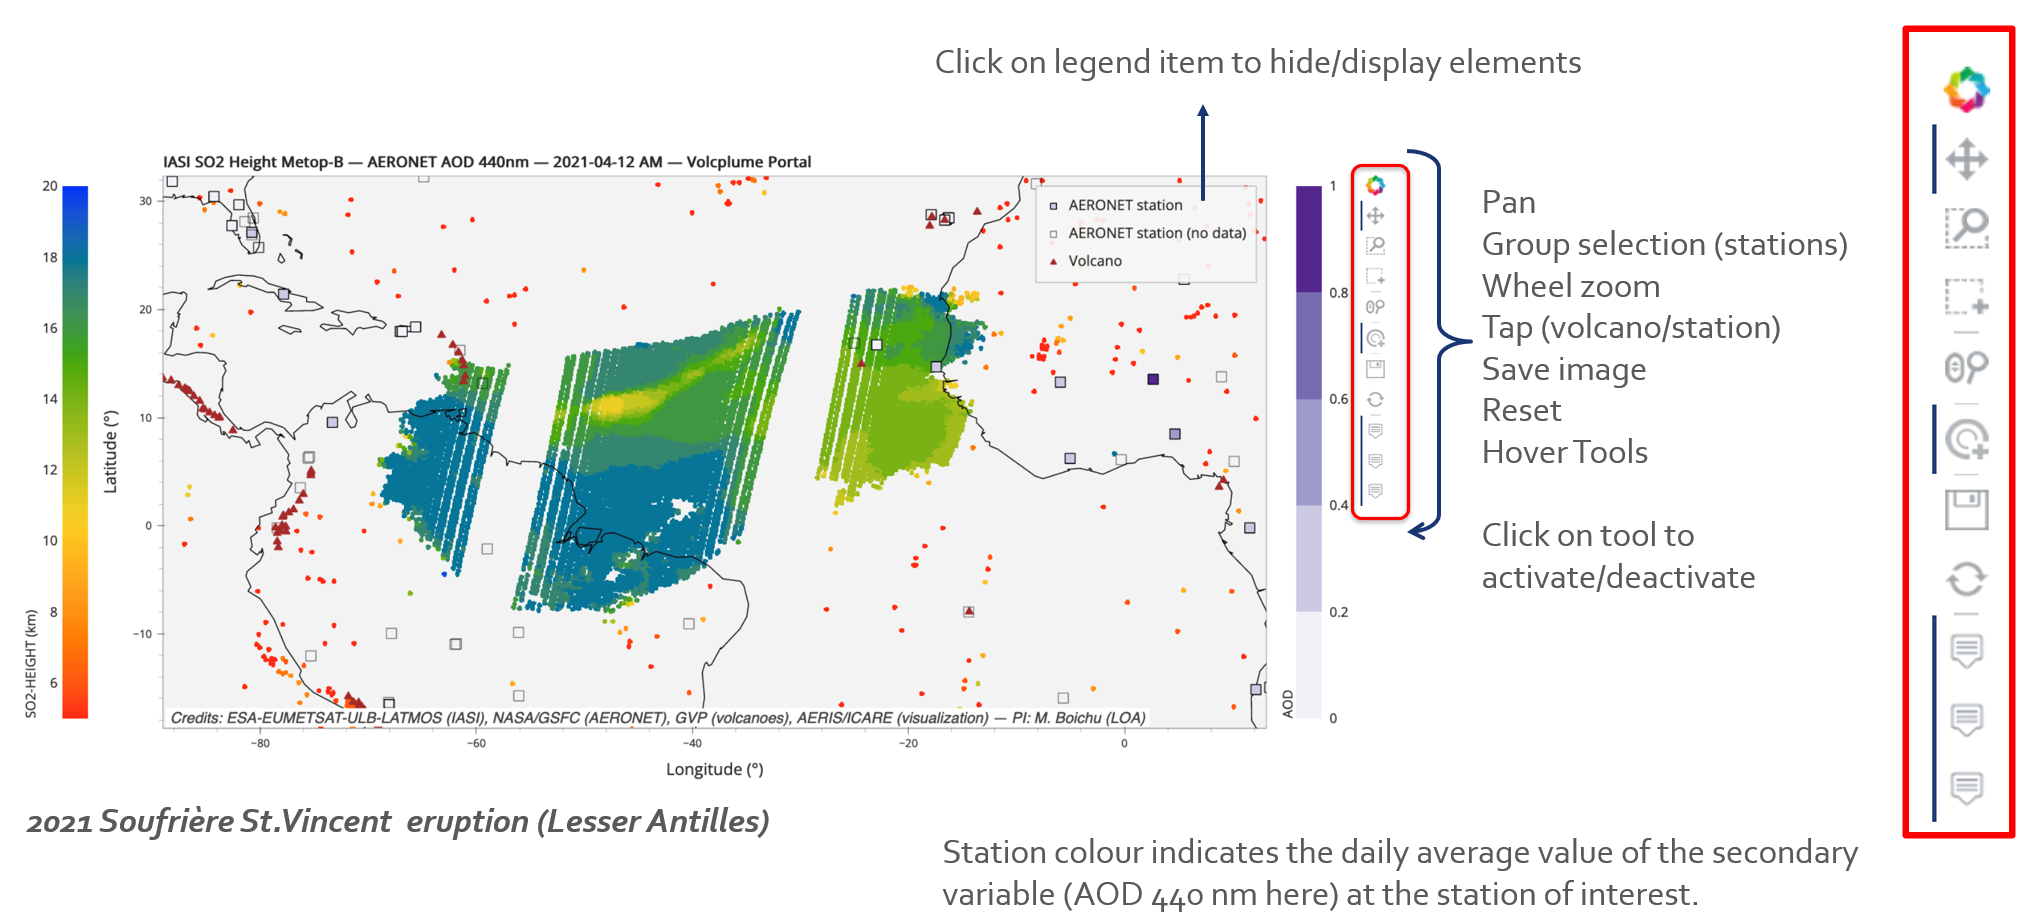
- IASI SO2-{n}km: {n}km height data within SO2_all_altitudes dataset in Metop-B/Metop-C LATMOS L2 SO2 product (assumed altitude 5, 7, 11, 13, 16, 19, 25 km) vertical slider to explore the different levels
- IASI SO2 (at assumed height): SO2_interpolated dataset in Metop-B/Metop-C LATMOS L2 SO2 product
- IASI SO2 Height: SO2_vertical_level dataset in Metop-B/Metop-C LATMOS L2 SO2 product
Aura/OMI
- OMI SO2: ColumnAmountSO2_{PBL/TRL/TRM/STL} datasets in L2 OMSO2 products, vertical slider to explore the different levels
- OMI Cloud Fraction: CloudFraction dataset in L2 OMSO2 products
- OMI Aerosol Index: UVAerosolIndex dataset in L2 OMSO2 products
Suomi-NPP/OMPS
- OMPS SO2: ColumnAmountSO2_{PBL/TRL/TRM/TRU/STL} datasets in L2 OMPS NMSO2 products (PCA algorithm), vertical slider to explore the different levels
- OMPS Cloud Fraction: CloudFraction dataset in L2 OMPS NMSO2 products
- OMPS Aerosol Index: UVAerosolIndex dataset in L2 OMPS NMSO2 products
Aqua/MODIS
- AOD at 550 nm (Aerosol Optical Depth): AOD_550_Dark_Target_Deep_Blue_Combined dataset in gridded version of MYD04 L2 products
PARASOL/POLDER
- AOD at 443 nm: AOD443, FineAOD443 and CoarseAOD443 datasets in gridded version of L2 products (GRASP algorithm)
- AE 670-875 nm (Angstrom exponent): AExp dataset in gridded version of L2 products (GRASP algorithm)
- SSA (Single Scattering Albedo) at 443 nm: SSA443 dataset in gridded version of L2 products (GRASP algorithm)
- Refractive Index: RealRefIndSpect443 and ImagRefIndSpect443 datasets in gridded version of L2 products (GRASP algorithm)
GEOSTATIONARY SATELLITES (GOES-16, GOES-17, HIMAWARI-8, MSG-2, MSG-4)
- GEO Brightness Temperature at various IR channels (10.3, 10.4, 10.8, 11.2, 12.0 µm depending on instrument) from L1_B products
- GEO ASH/Natural False Colour: SEVIRI-Like RGB compositions (user guide, recipes) from L1_B products
- GEO SO2 (GOESNG and HIMAWARI only): NOAA SO2 RGB composition (reference)
- GEO Cloud Top Altitude: ctth_alti dataset in NWC SAF GEO CLOUD products
- GEO Cloud Top Pressure: ctth_pres dataset in NWC SAF GEO CLOUD products
- GEO Cloud Top Temperature: ctth_tempe dataset in NWC SAF GEO CLOUD products
ECMWF/ERA5
- ERA5 Wind: u, v wind components datasets from ERA5 reanalysis (hourly), analysis or forecast (every 6 hours) products, with a 0.25°x0.25° resolution. A vertical slider allows the user to explore wind variability with the 37 (reanalysis) or 25 (analysis and forecast) pressure-levels.
« Secondary variable » products: ground-based networks & spaceborne LIDAR
AERONET network (sun/lunar photometry)
- AERONET AOD 440nm (Aerosol Optical Depth): AOD_440 daily/hourly average per station from AERONET V1.5 AOD data
- AERONET AE 440-870nm: 440-870_Angstrom_Exponent daily/hourly average per station from AERONET V1.5 AOD data
GEOD’AIR network (air quality)
- GEOD’AIR SO2: ground-level mass concentration daily/hourly average per station from GEOD’AIR SO2 data
- GEOD’AIR PM2.5 or PM10: ground-level mass concentration daily/hourly average per station from GEOD’AIR
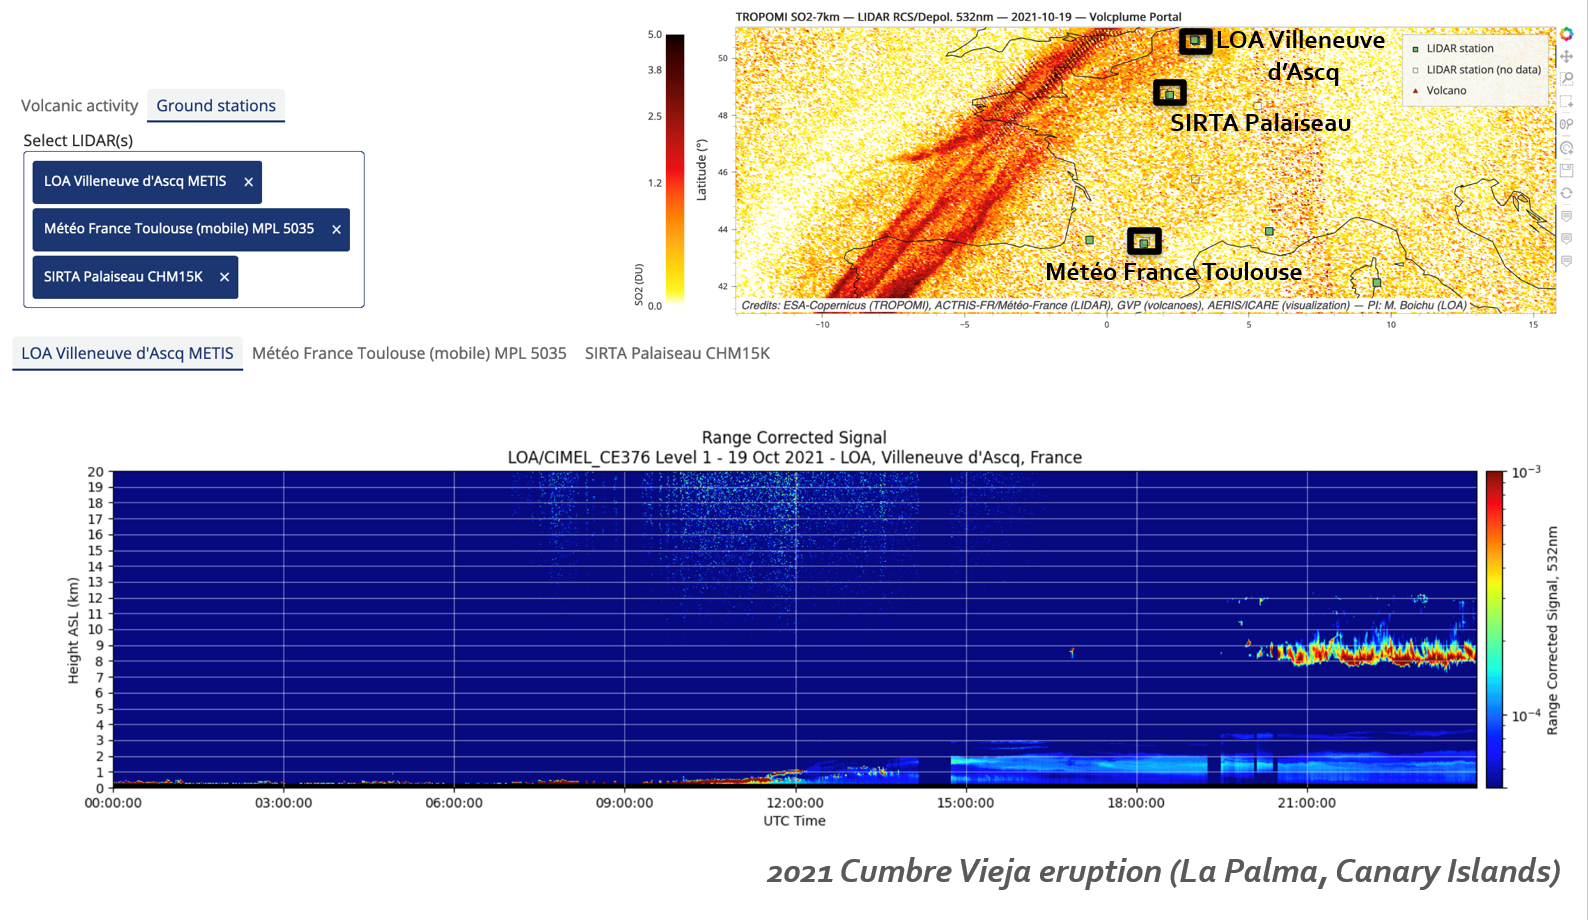
LIDAR ground stations
- LIDAR Profile 532nm: quicklooks for RCS (range-corrected signals) and depolarisation ratio from L1B products (ACTRIS & Météo-France LIDAR networks)
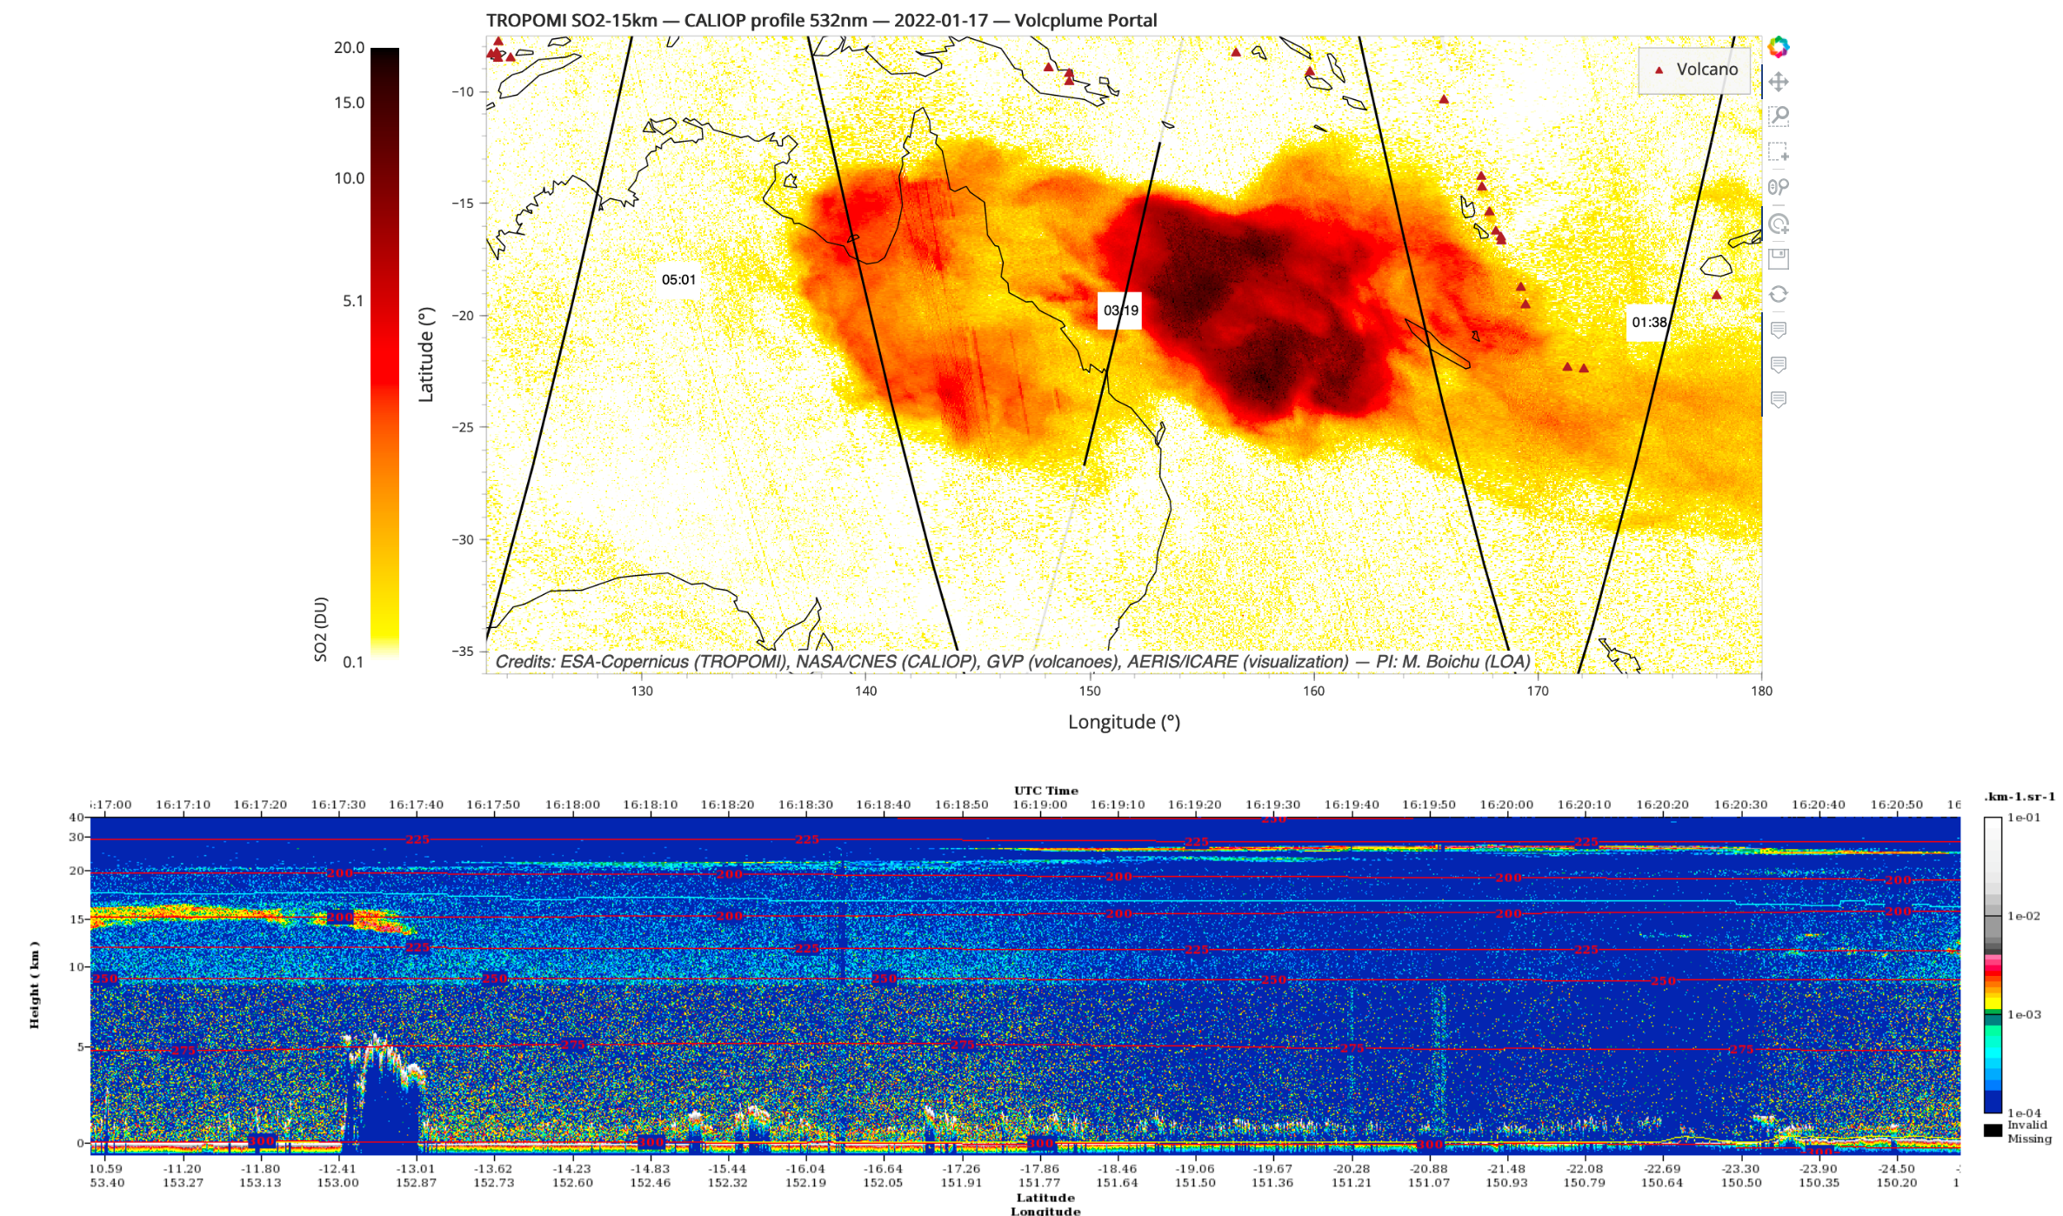
CALIOP spaceborne LIDAR
- CALIOP Profile 532nm: ground tracks and corresponding RCS quicklooks from L1B products (Standard, Validated Stage or Expedited)
Interactive map plot
Customisation widgets
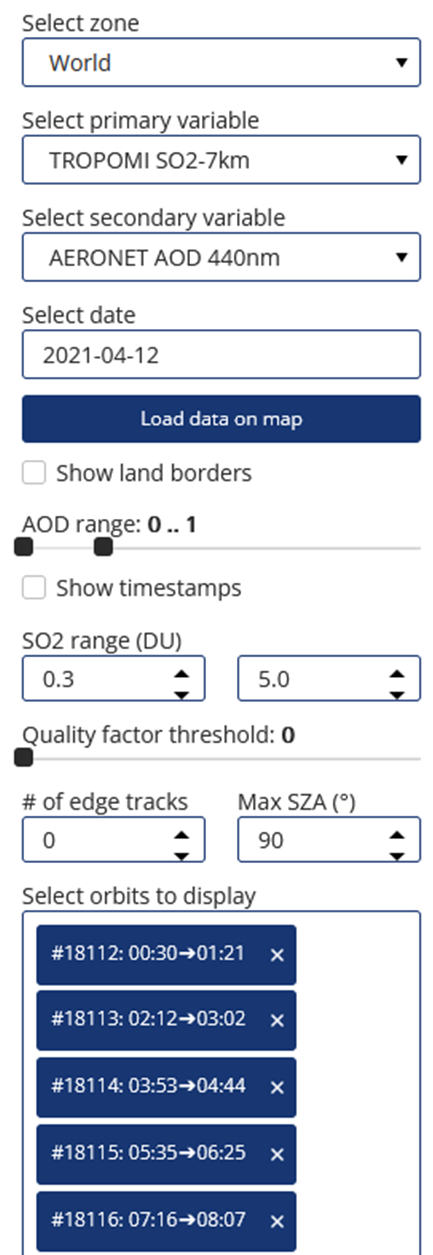
Once primary data are loaded on the map, additional widgets pop up in the sidebar to allow further customisation.
These depend on the selected data but may include: orbit filter, quality filter, subchoice of dataset, SZA filter, edge tracks filter, colour map bounds, timestamps…
Plot tools
Exploration of geostationary data
Explore and save animation
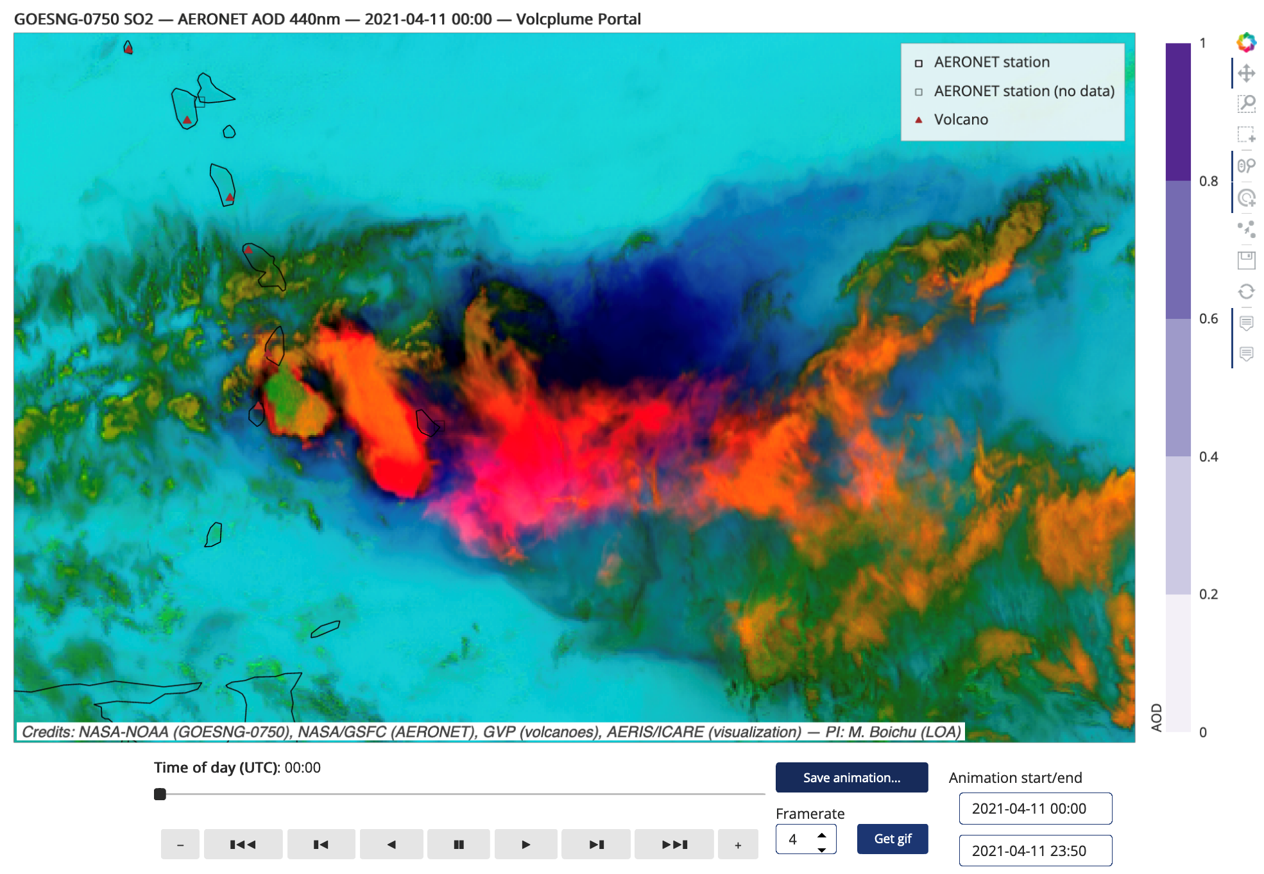
Temporal resolution between 10 & 30 min
Download animation:
Click on Save animation button to display more widgets allowing to save an animation (GIF format), with editable animation bounds and framerate (fps)
Track plume parcels and save trajectories
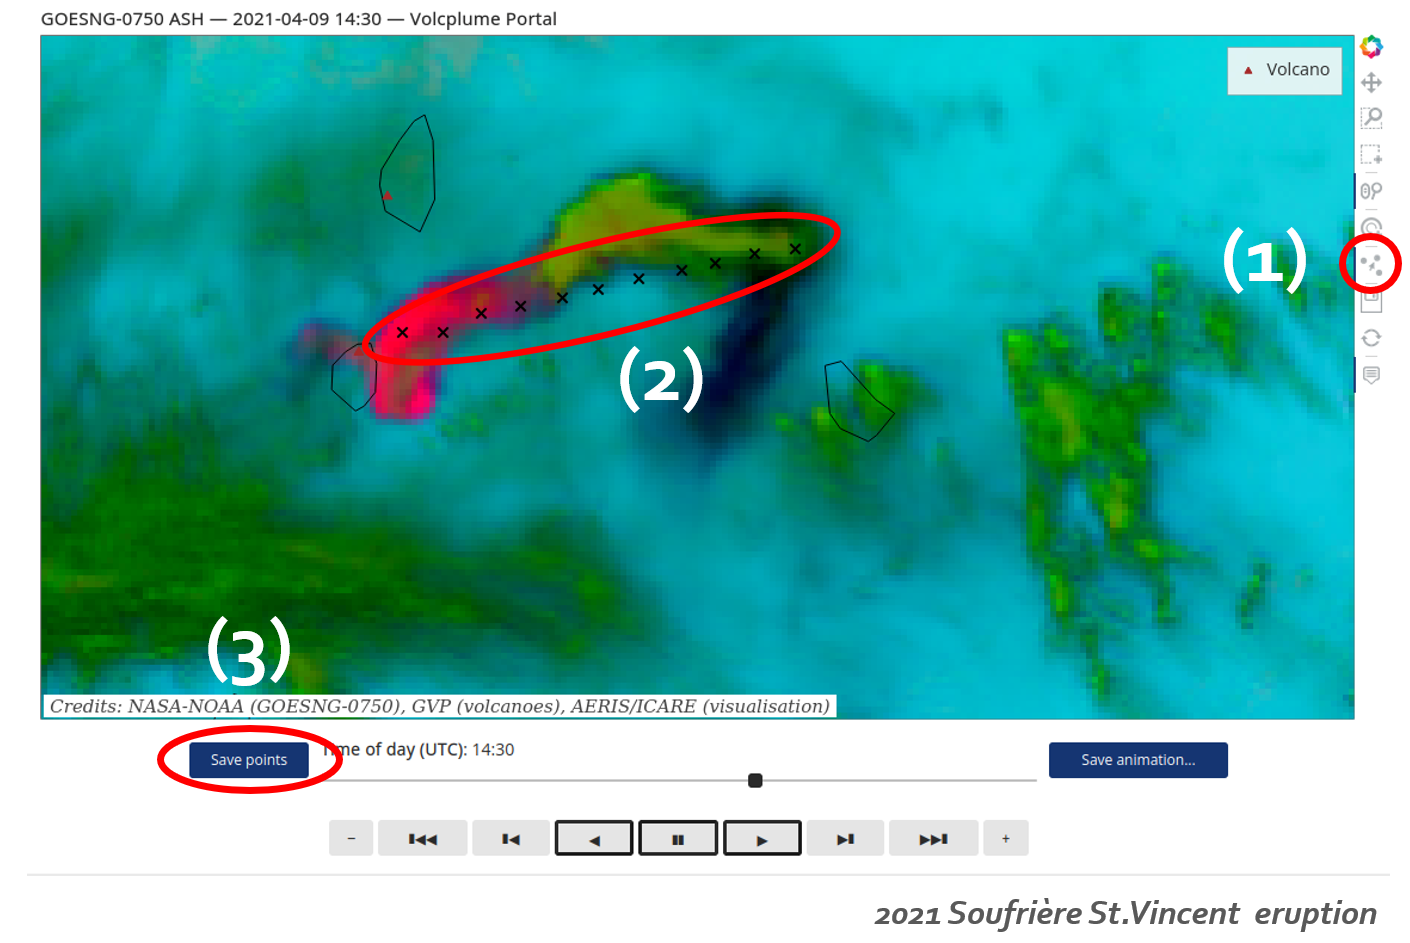
- Activate “Point Draw” tool
- Click on the map to add points (typically one per timestep to track a plume parcel)
- Click on “Save points” to retrieve parcel coordinates (csv file)
Exploration of CALIOP spaceborne LIDAR data
Satellite ground tracks appear on the map
Click on a track to display a quicklook strip that corresponds to the selected portion
« Ground stations » panel
« Station overview » mode for sun/lunar photometry data
With AERONET photometry data loaded on the map, select the « Station overview » mode and select station(s) (click on station or type station name in selection widget)
One tab per station will be created with:
- Day & night AOD 440 nm, AE 440-870 nm, SDA fine/coarse 500 nm and inversion variables (effective radius in coarse/fine mode, single scattering albedo @440nm) time series with historical monthly range (mean +/- std)
- AE v AOD scatter plot
- Size distribution
- SSA and complex refractive index as a function of wavelength
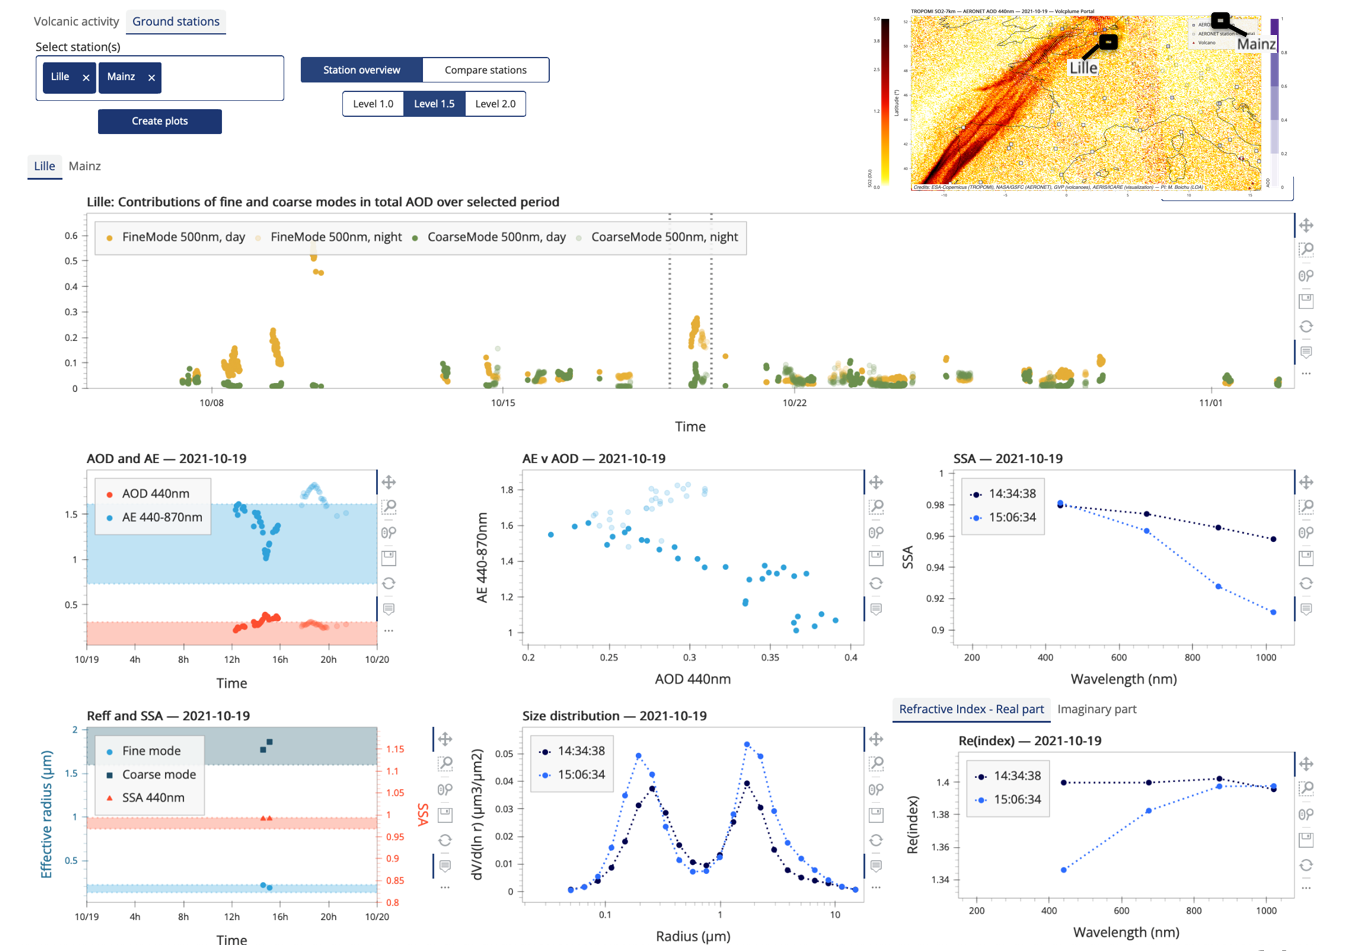
NB: SDA and inversion data are not always available. As volcanic particles can sometimes be confused and filtered as clouds, L1.0, 1.5 & 2.0 data are available.
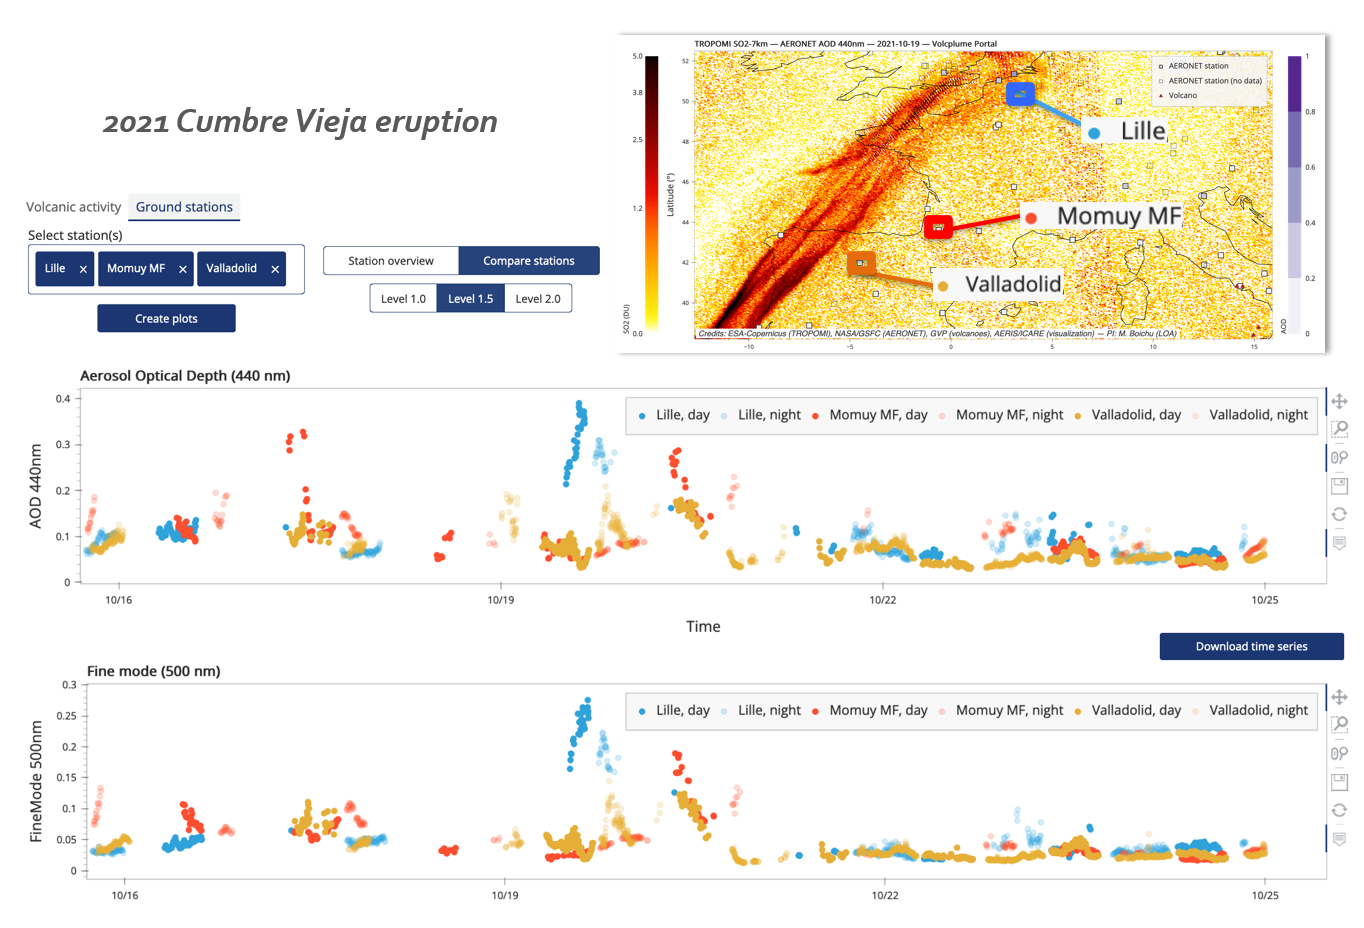
« Compare stations » mode
With AERONET photometry data loaded on the map, select the « Compare stations » mode and select station(s) as well as a set of variables and the time period of interest.
Click on Create plots to create one plot per variable with time series allowing a multi-station data analysis. Time series can be downloaded as csv files.
Click on station label to hide/display associated time series to facilitate multi-station data comparison.
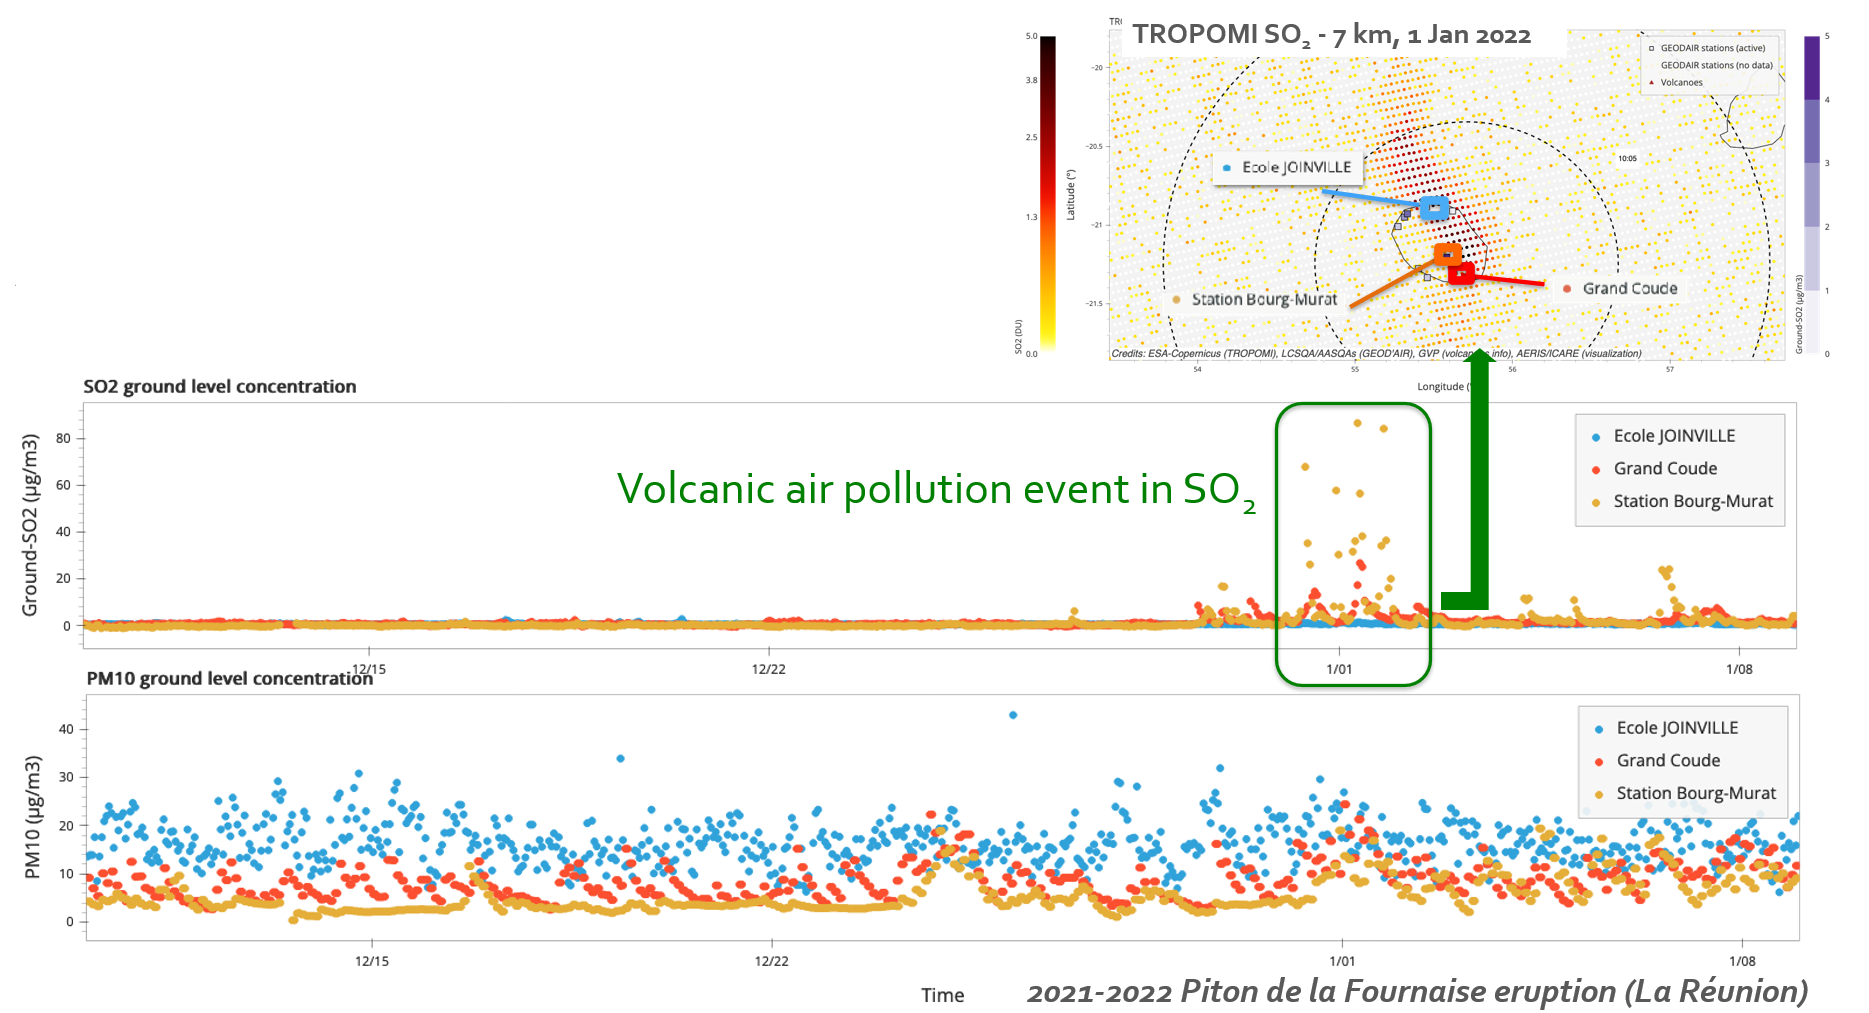
With GEODAIR data loaded on the map,
select one or more stations
Time series of hourly-averaged ground-level
SO2/PM2.5/PM10 mass concentrations
from GEOD’AIR are displayed in the station panel
Explore ground-based LIDAR data
Click on a station or enter its name in the “Select LIDAR(s)” widget. Quicklooks of RCS (range-corrected signals) or depolarisation appear in the station panel.
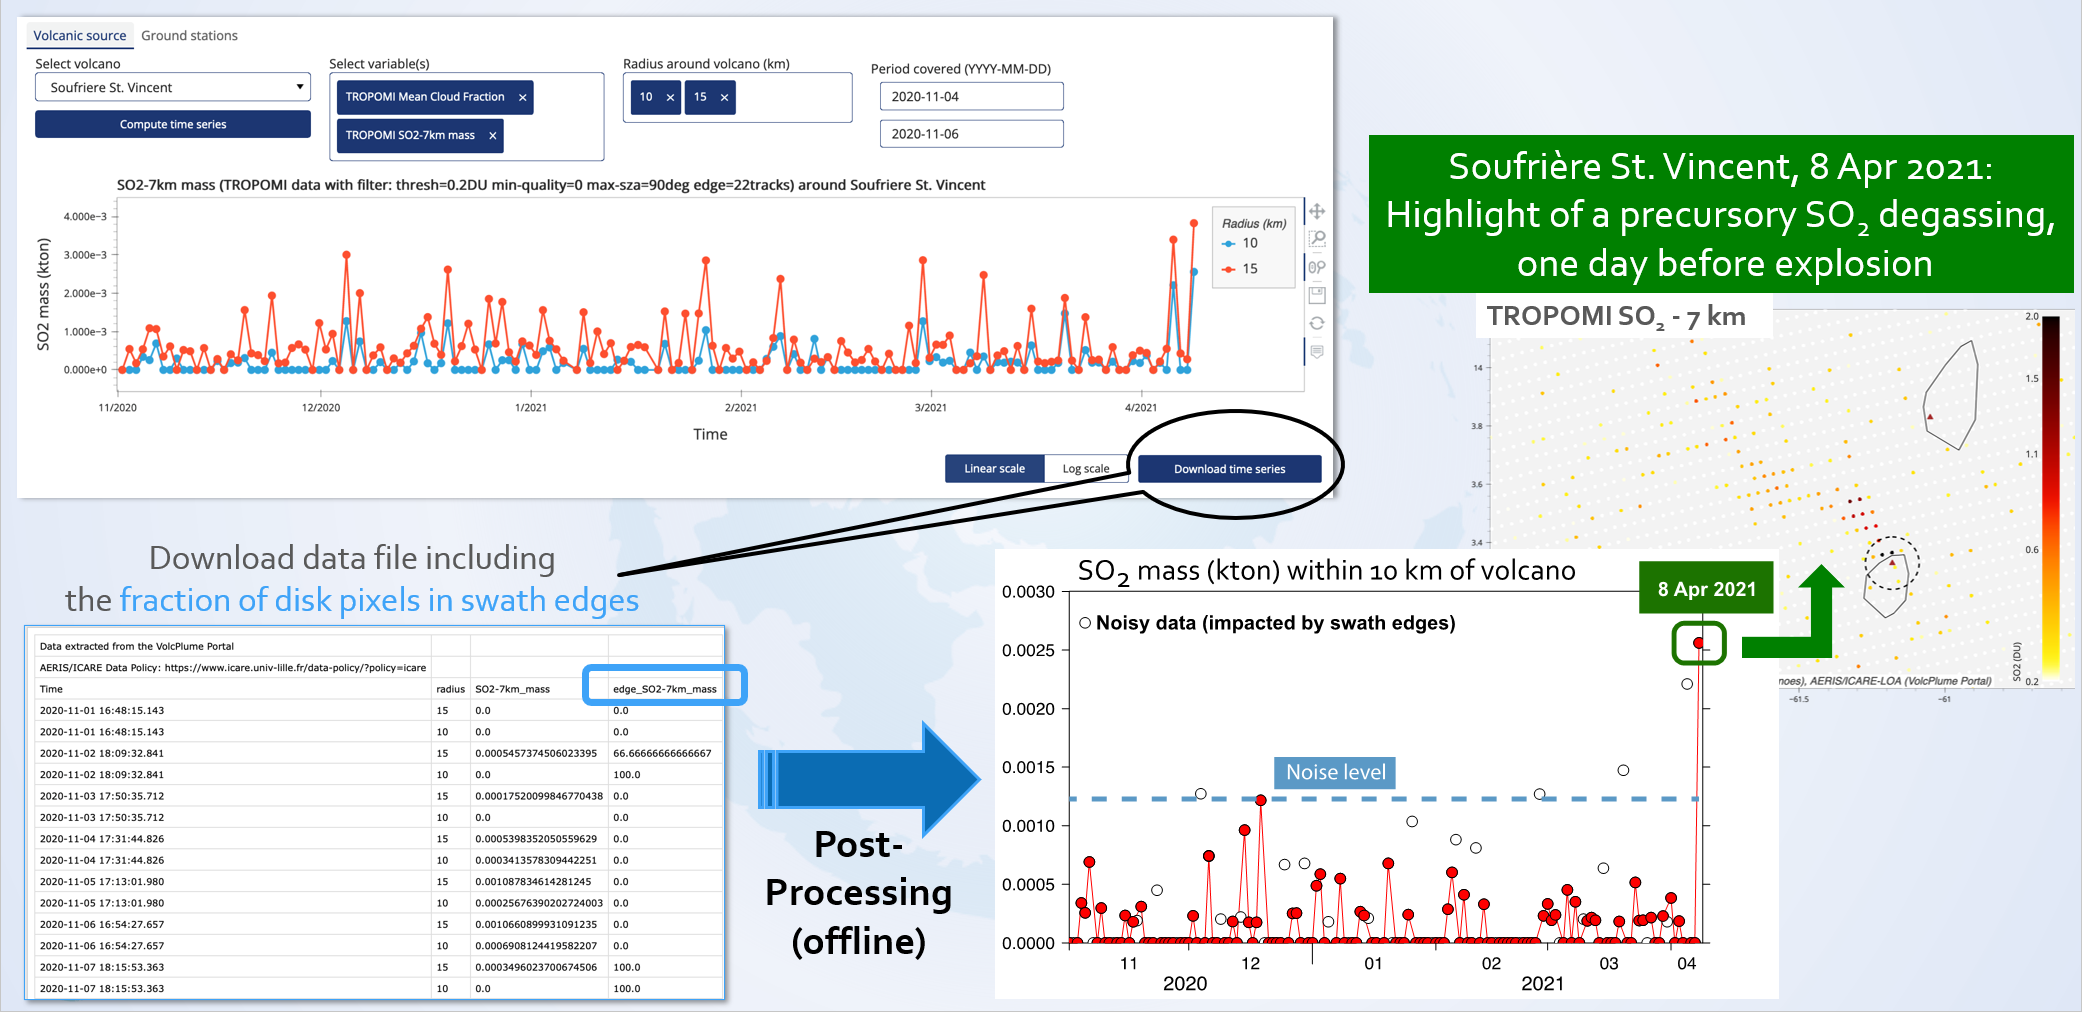
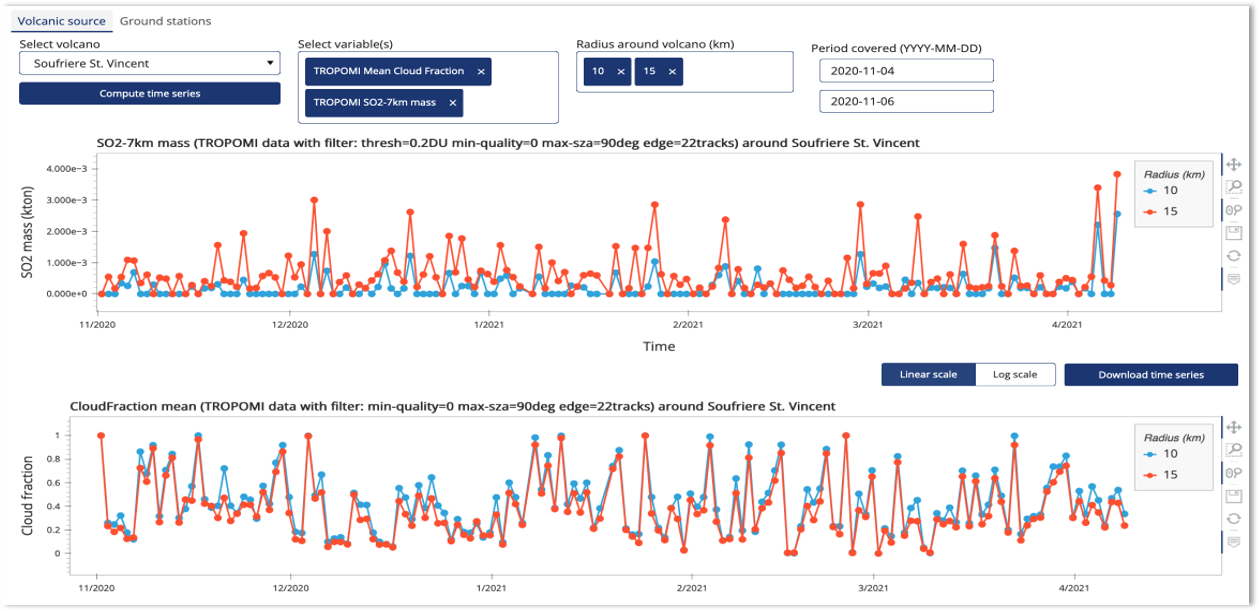
« Volcanic source » panel
Compute time series of emission parameters around selected volcano
Select:
- Volcano (click on map or using selection widget)
- One or several distance(s) (will display corresponding disk area(s) around volcano)
- One or several variables of interest
- Period of interest
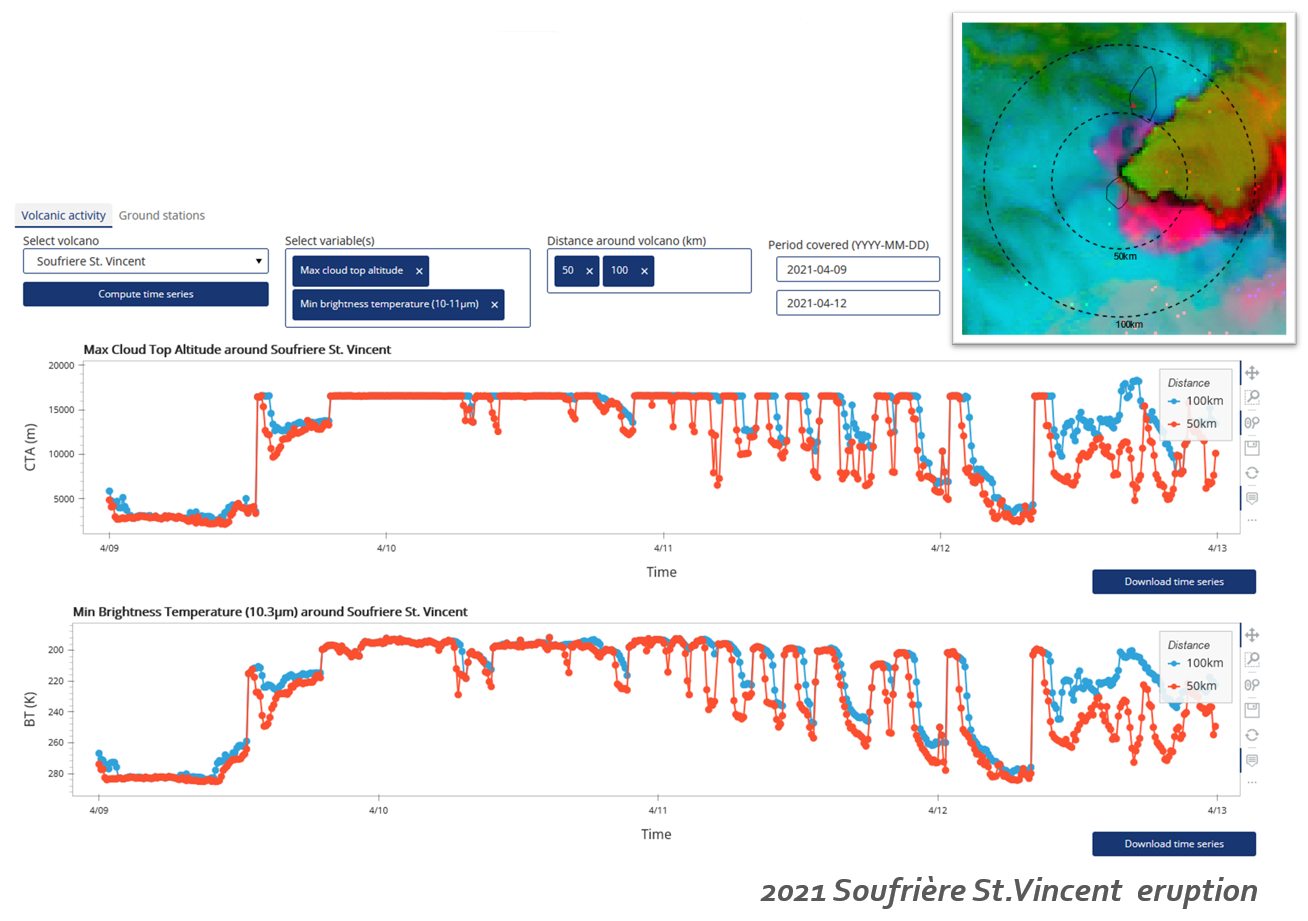
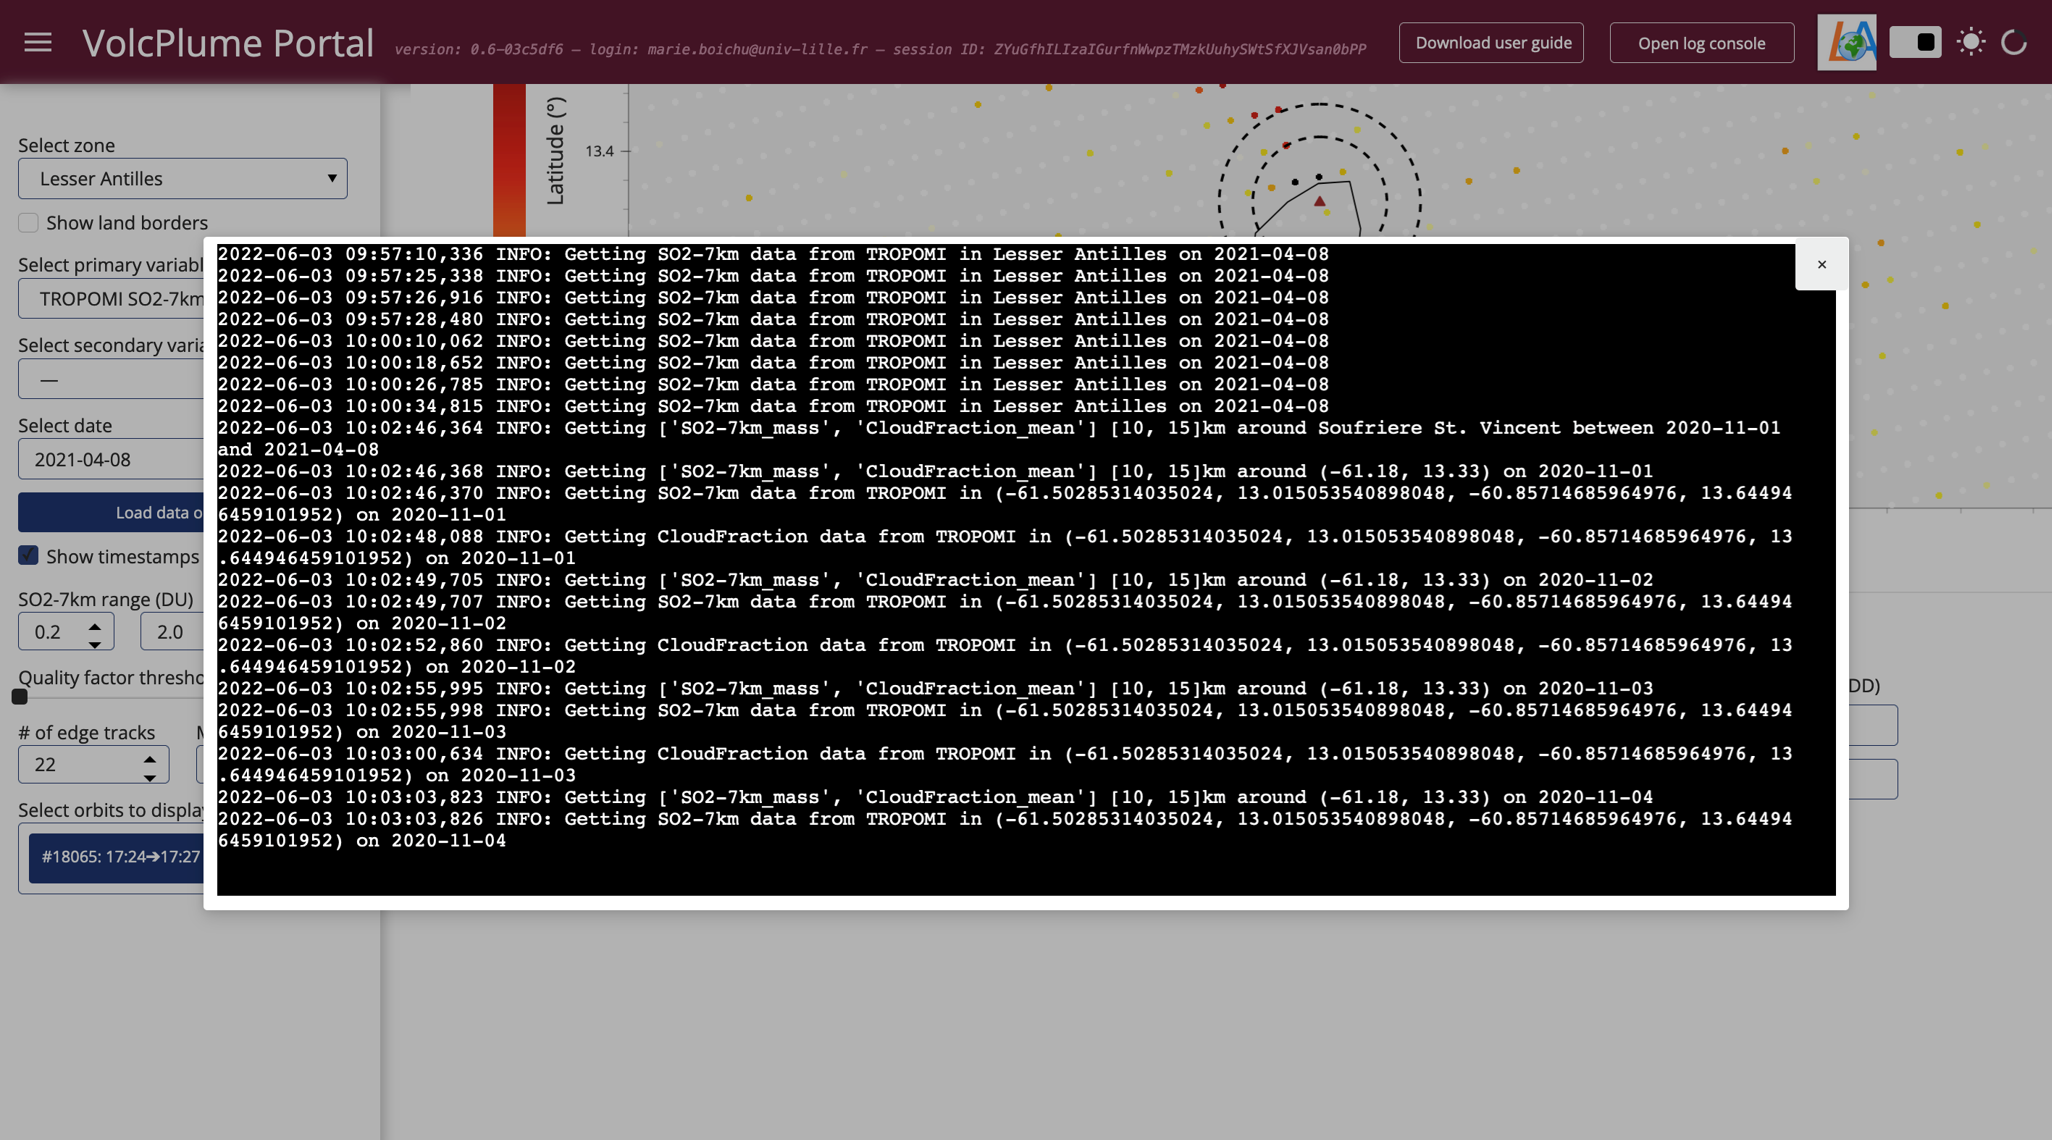
Click on Compute time series button to launch the computation. Depending on the temporal extent of your request, the computation will either be performed in the foreground of your live session (log console will open for monitoring purposes) or in the background by an independent worker. In this case, you will receive an e-mail with a download link to the results once the computation is over. The data is also temporarily hosted on our server and can be plotted directly from the VolcPlume Portal (select your files in the « Plot existing time series » tab of the « Volcanic source » panel). If it is no longer available, you can still upload your csv files instead.
Time series of minimum brightness temperature around volcano
Information on brightness temperature (BT) is available from geostationary satellite observations at several channels sensitive to ash particles. For a given channel, the portal returns the minimum of brightness temperature values over a disk area centered at the volcano. The radius of the disk can be interactively chosen by the user. Minimum BT is a proxy of the altitude of the top part of the aerosol-rich plume.
Time series of plume-top altitude around volcano
NWC SAF CTTH products from geostationary satellite observations are used here to evaluate the altitude (and associated pressure and temperature conditions) reached by the top part of the ash-rich plume over the volcanic source with time.
Pixels corresponding to ash particles are isolated by applying a filter removing high semi-transparent cirrus clouds and keeping only opaque and high thick cloud pixels (i.e. keeping bits 2 to 4 and 9 to 12 of the CTTH_method parameter, see reference). The portal returns the maximum value of the altitude of these selected ash-rich pixels over a disk area centered at the volcano. The radius of the disk can be chosen interactively. Note that this product is not suitable for altitude retrieval of stratospheric plumes.
Time series of daily SO2 mass
The computation returns daily SO2 mass from low Earth orbit satellite observations by integration over a disk area centered at the volcano after a prior linear interpolation on a 0.05° regular grid. Integration over a circular domain allows for compensating cross-plume diffusion, without requiring prior knowledge of the direction of plume transport. The radius of the disk can be interactively chosen by the user.
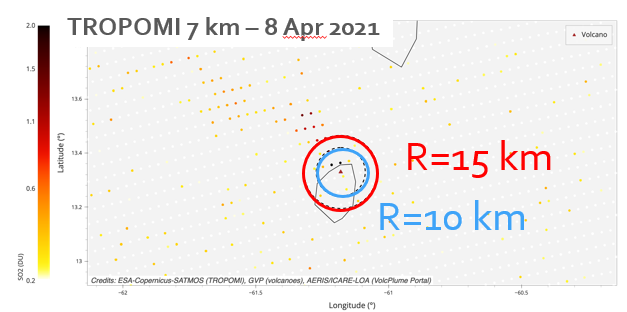
Data points will be discarded for high SZA (default for TROPOMI: 70°), low quality factor (only for TROPOMI). Interpolated SO2 column amounts lower than a threshold value are ignored (default for all instruments 0.5 DU). The fraction of points belonging to noisy edge tracks (default for TROPOMI: 30 first and 30 last swath tracks) is also returned. Default filter values for a given instrument will be overridden by manually selected widget values if data for this instrument is currently loaded on the map. All information regarding the filter values used are reported on the resulting plot as well as the downloadable csv files.
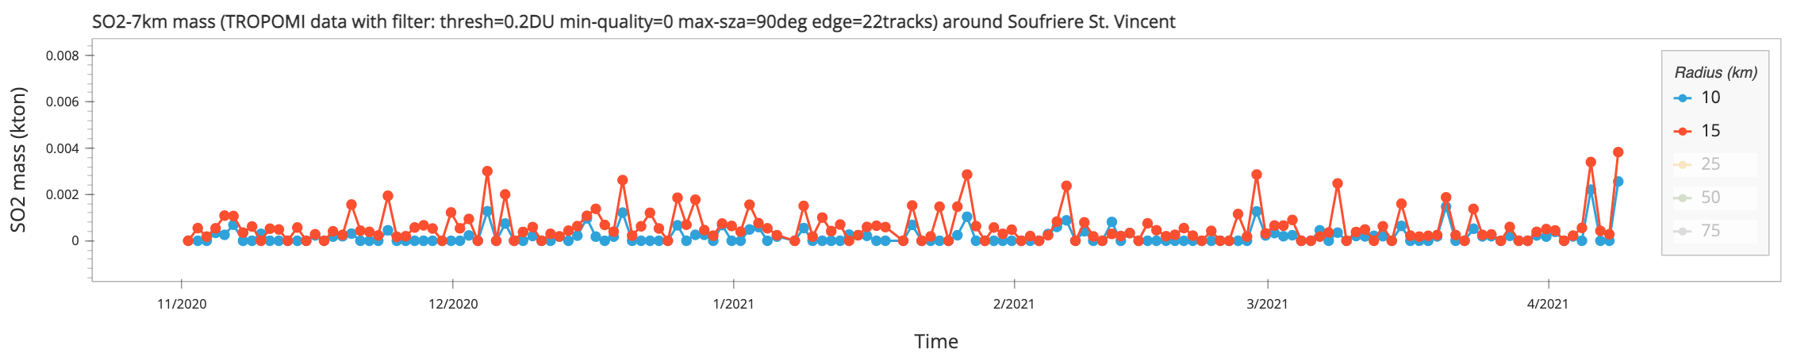
Downloadable files allow the user to perform offline data post-processing in order to highlight volcanic degassing signals from noisy background values.
Time series of daily mean cloud fraction
The mean cloud fraction over the same disk area can also be computed as an auxiliary product. This information can be used to assess the quality of the daily SO2 mass product as the presence of meteorological clouds can bias the in-plume SO2 column amount retrieval. In the literature, a threshold of 30 % cloud fraction is commonly reported as a criterion for selecting reliable pixels. Again, data can be downloaded for off-line post-processing.
On-demand calculations
Regarding emission data processing, the progress in calculation is displayed in real-time