POLDER/PARASOL scientific products include the following parameters (Click on a product name to get the product description and a sample image):
« Aerosols » products: Aerosols Optical Thickness (AOT) Aerosols Optical Thickness (AOT) Angstrom ExponentNon-Sphericity Index for the Coarse Mode Angstrom ExponentNon-Sphericity Index for the Coarse Mode | « Earth Radiation Budget, Water Vapor and Clouds » products:Cloud coverCloud phaseCloud optical thickness and Albedo Cloud pressureWater vapor integrated content« Cloud Droplet Effective Radius » products |
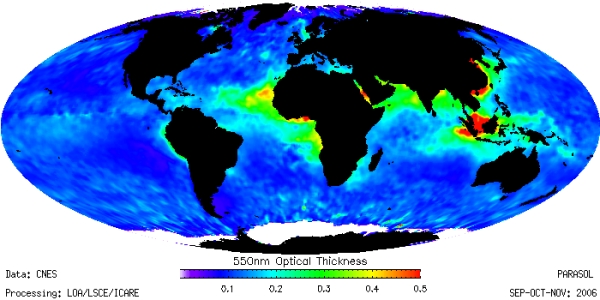
Aerosols Optical Thickness (AOT)
The Aerosols Optical Thickness (AOT) characterizes the aerosols concentration in the atmosphere and depends on the particle characteristics (refractive index, shape, size compared to the wavelength, particle number per unit volume). The inversion scheme is based on the spectral normalized radiances L and the polarized normalized radiances in the 865 and 670 nm channels. It is derived over ocean only because of the unknown surface contribution over land. The characteristics of both aerosol modes (accumulation and coarse) are derived.
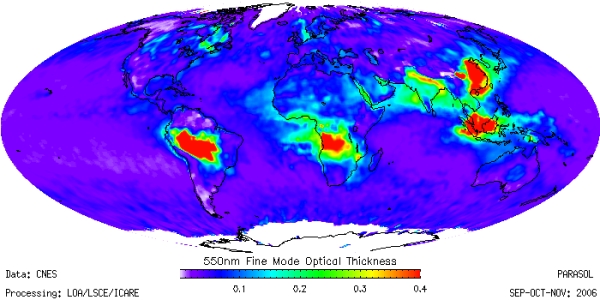
The Fine Mode Optical Thickness is the AOT resulting from the fine mode of the aerosols size distribution (particle sizes smaller than about 0.35 micron. It is derived from the polarized radiances. Over land, where the surface contribution to the total radiance is generally large, the inversion scheme uses the polarized radiances in the 865 nm, 670 nm and blue channels. As the largest particles (radius > 0.5 µm) generate low polarization, only the optical characteristics of the accumulation mode are derived. Over ocean, the inversion scheme is based on the spectral normalized radiances L and the polarized normalized radiances in the 865 and 670 nm channels.
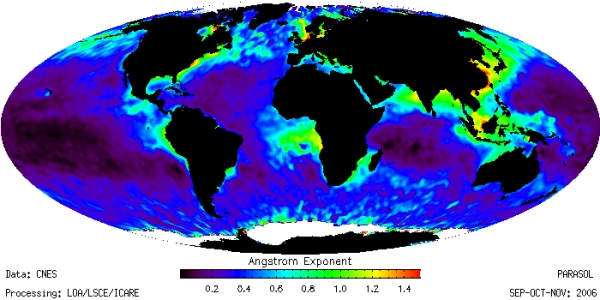
Angstrom Exponent
The Angstrom exponent , which relies on the spectral slope of the aerosol optical thickness between 865 and 670 nm, is a simple indicator of the mean particle size (it decreases when the particle size increases).
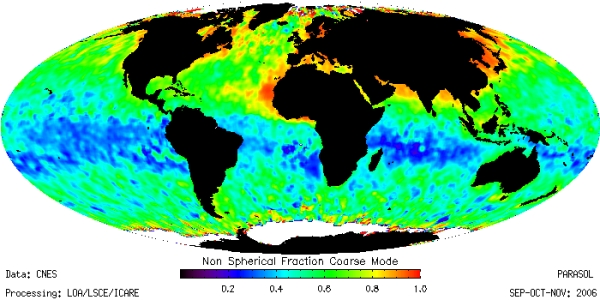
Non-Sphericity Index for the Coarse Mode
Ratio (AOT of large non-spherical particles)/(AOT of large particles). ID=0 for large aerosols consisting only in spherical particles. ID=1 for large aerosols consisting only in non-spherical particles. Note that the algorithm that generates this parameter requires specific viewing geometry conditions. The angular sampling of POLDER is not continuous. Thus, « valid » pixels for the application of the algorithm are not evenly distributed, which results in the alternance of regions with/without retrievals.
Cloud detection and Cloud Cover
The interesting and unique feature about Parasol retrievals for clouds is its ability to drive the inversion process by a proper discrimination of cloud phase and cloud microphysical model thanks to the directional polarization measurements. Moreover, the consistency check of the retrieved parameters direction by direction is an indicator of the performance of the retrieval algorithms. The first stage of the « ERB & clouds » line is the recognition of cloud-contaminated pixels. This step is crucial since it controls further processing and it has a major impact on determining others products.
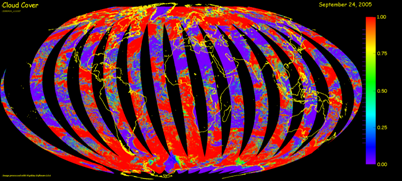
The cloud detection algorithm is based on a series of sequential threshold tests applied to each individual pixel (6 km) and for every viewing direction. Five tests aim at detecting clouds and three more tests are added in order to identify the clear pixels. If a PARASOL pixel fails all of the tests, it remains unclassified for a given viewing direction. If the pixel remains undetermined, it is then relabelled as clear or cloudy depending on the classification of the neighbouring pixels and the spatial variability of the reflectance at 865nm. Afterwards, when all of the elementary pixels are identified as cloud-free or cloudy the cloud cover is computed at the super-pixel scale (3 x 3 pixels, 20km resolution), direction by direction.
Clearly, the multidirectional capability of PARASOL is very useful for discriminating between clear and cloudy pixels. As an example, over ocean a simple reflectance threshold test can always be applied since a PARASOL pixel can be observed with angular configuration outside the glint region.
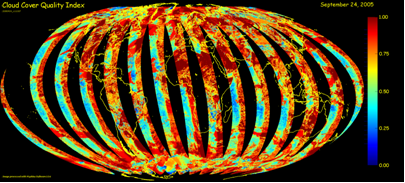
On the other hand, as illustrated on the figure here-above, a cloud cover confidence index is defined from the result of the cloud detection algorithm. 1 is for high confidence and 0 is for low confidence. This parameter takes advantage of the multidirectional capability of PARASOL. For instance light blue lines west of the PARASOL orbits are mainly due to the presence of the sunglint in these angular regions.
Cloud Thermodynamic Phase
PARASOL cloud phase is unique and based on polarization signatures. The method has been refined to better account for complex mixed cases. A phase index (clear, ice, liquid, mixed, undetermined) with confidence level is now provided. The ability to detect strong aerosol events over underlying liquid clouds has been proved.
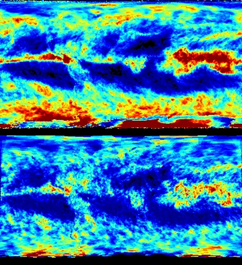
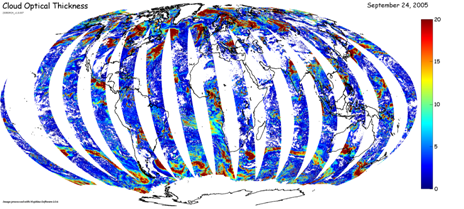
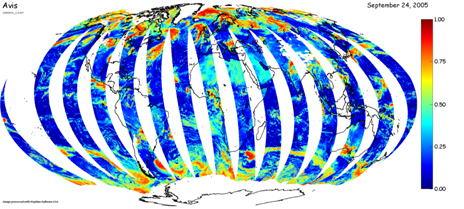
Cloud Optical Thickness and Albedo
To derive the albedo from bidirectional reflectance observations, or equivalently, the hemispherical flux from radiance observations, several approaches are possible. Ours is based on radiative transfer modelling. In a first step, the narrowband albedo is derived from bidirectional reflectances using a radiative transfer model. This retrieval is performed at 490, 670, and 865nm. Spectral cloud optical thickness and narrowband albedo are derived using a look-up table (LUT) technique. LUTs are calculated using a plane-parallel radiative transfer model applied to two cloud types (ice and liquid water) depending on the cloud thermodynamical phase index derived from PARASOL polarized reflectances.
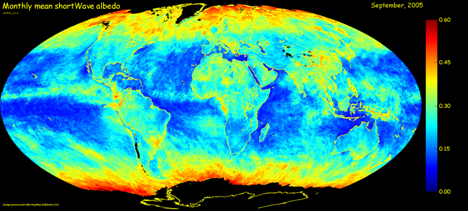
In a second step of the analysis, all three narrowband albedo products are used to estimate the broadband shortwave albedo.
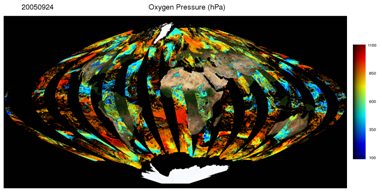
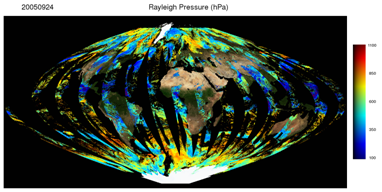
Cloud pressures
PARASOL provides 2 pressures. The Rayleigh pressure uses polarized measurements at 490 nm, whereas oxygen pressure relies on radiances at 763 and 765 nm. The former is sensitive to the cloud top, the latter to cloud middle.
Water Vapor
PARASOL retrieves the water vapor integrated content over land (and over the ocean in glint conditions) by a differential absorption method applied to the 910 and 865 nm chanels. The algorithm is tuned over ocean wrt AMSR (Polder used SSMI). The performance was evaluated for POLDER 2 against radiosonde measurements and showed no bias and a rms difference of 3.4 kg/m2.
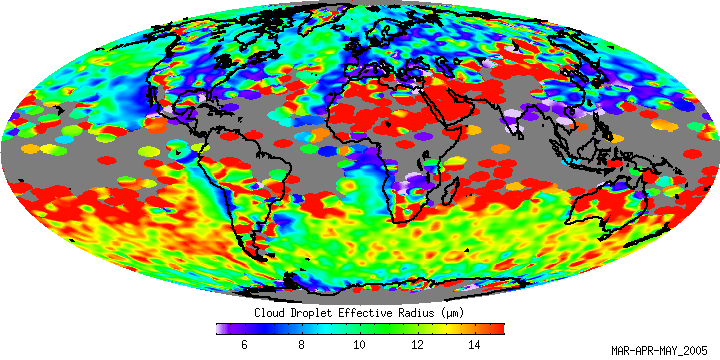
Cloud Droplet Effective Radius
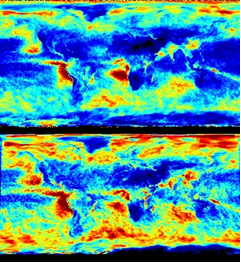
Cloud Droplet Radius (CDR) is not part of the standard POLDER/Parasol retrieved parameters. It can be retrieved at a low spatial resolution (on the order of 100 km) with strong requirements on the homogeneity at this scale. Besides, the retrieval procedure requires a rather narrow size distribution. On the other hand, it is believed that, when these specific conditions are met, the retrieval is very precise and accurate. More information is available in Bréon, F.M. and M. Doutriaux-Boucher, 2005: A comparison of Cloud Droplet Radii measured from space, IEEE Trans. Geos. Rem. Sens. 43 (8): 1796-1805. Cloud Droplet Radius is estimated from the directional signature of the polarized reflectance. For scattering angles between 140° and 170°, the scattering phase function shows interference patterns that are very sensitive to the droplet size. The polarized measurement of Parasol provides a near-direct measurement of the polarized phase function, which makes it possible to retrieve the effective droplet radius. Note that the polarization-based retrieval is sensitive to the very cloud top (i.e. the upper layer with an optical thickness less than 1).
The Parasol CDR product clearly shows the main patterns of the CDR spatial distributions. The largest CDR are found in the cleanest atmosphere, i.e. over the oceanic areas far from any land influence. On the other hand, the smallest CDR are found in the most polluted environment. The other pattern is a general decrease of CDR towards the pole. The annual cycle is driven by the seasonality of biomass burning which impacts the mean CDR (aerosols emitted by the fire lead to reduced CDR). Interannual variations are limited.
Please find CDR monthly browses on the Browses Images/Multi-Sensor Interface rubric and CDR daily products on Data Access/PARASOL/CDR rubric (Note the description of the ASCII file CDR daily products: Parasol orbite number / date / local time / latitude / longitude / CDR / standard deviation / quality index).