Average Tool : Statistics of a list of HDF4 files
vg Language/Format: Numpy, Python
Application type(s): Analysis
Related project(s): MSG, PARASOL
Description
This tool processes the average of multiple products and computes some additional statistics like the standard deviation, maximum and minimum per pixel. The input files and the output files are in HDF format. This tool is divided into three modules which can be used separately. With options, this tool can perform its calculations within a temporal distribution (start date and end date) on a selected area (subsetting’s option).
The first module selects the files (at this stage limited for PR_ATM products ( cloud and aerosol) from PARASOL sensor and SEVIRI_AER_OC from SEVIRI sensor . The second module performs statistical calculations and store data in a file. The last module records data in .png from HDF file of Average_processor.py. Each module contains options (subsetting, output directory,…) for better use of data.
Limitation
A program, Average_tools.py, is available to use the three modules with all options but only for the product SEVIRI_AER_OC and five variables of product PR_ATM. A more generic tool is still under development.
Currently, all daily PR_ATM settings are accessible from this program :
- ATM_ANG_D_ : Angstrom Coefficient
- ATM_ANGFM_D_ : Angstrom Coefficient for fine mode
- ATM_TAUA_D_ : Aerosol Optical Thickness at 865 nm
- ATM_TAUAFM_D_ : Aerosol Optical Thickness at 865 nm for fine mode
- ATM_TAU_D_ : Cloud Optical Thickness
- ATM_WV_D_ : Total precipitable Water
- ATM_SDWV_D_ : Standard Deviation of Water Vapor
- ATM_QCC_D_ : Cloud cover quality index
- ATM_IQAI_D_ : Aerosol Inversion Quality Index
- ATM_TAUCSM_D_ : Aerosol Optical Thickness of The Coarse Spherical Mode at 865 nm
- ATM_REF_D_ : Aerosol Effective Radius Index
- ATM_PHASE_D_ : Cloud thermodynamic Phase
- ATM_QAVIS_D_ : Quality index of the albedo
- ATM_PRAY_D_ : Cloud Rayleigh pressure
- ATM_TAUCNM_D_ : Aerosol Optical Thickness of the Coarse Non-Spherical Mode at 865 nm
- ATM_REFFM_D_ : Fine Mode Aerosol Effective Radius
- ATM_POXY_D_ : Cloud Oxygen Pressure
- ATM_ASW_D_ : Shortwave Albedo
- ATM_AVIS_D_ : Albedo at 670/865 nm
- ATM_CC_D_ : Cloud Cover
More variables PR_ATM product will soon be available
The two variables SEVIRI AER_OC also accessible from this program :
- Aerosol_Optical_Depth
- Angstrom_Exponent
Usage
To select PARASOL or SEVIRI HDF files, the command line is :
python Average_tools.py  <Variable-ID> <start_date> <end_date> [options]

<Varaible-ID> :

To PARASOL : Variable Product PR_ATM, choose between :
    'ATM_WV_D_', 'ATM_TU_D_', 'ATM_TAU_D_', 'ATM_TAUCSM_D_', 'ATM_TAUCNM_D_', 'ATM_TAUAFM_D_', 'ATM_TAUA_D_', 'ATM_SDWV_D_',
    'ATM_REFFM_D_', 'ATM_REF_D_', 'ATM_QCC_D_', 'ATM_QAVIS_D_', 'ATM_PRAY_D_', 'ATM_POXY_D_', 'ATM_PHASE_D_', 'ATM_IQAI_D_',
    'ATM_CC_D_', 'ATM_AVIS_D_', 'ATM_ASW_D_', 'ATM_ANGFM_D_', 'ATM_ANG_D_'

To SEVIRI : Variable Product SEVIRI, choose between
    'Aerosol_Optical_Depth' and 'Angstrom_Exponent'

<start date> and <end date> : timestamp(s) of the input files

     YYYY-MM-DDTHHMM and  YYYY-MM-DDTHHMM  : will produce the browses during a given period at daily between hours (Ex : 2007-09-10T0800 2007-09-15T1310) only for SEVIRI

     YYYY-MM-DD and  YYYY-MM-DD  : will produce the browses during a given period at daily (Ex : 2007-09-10 2007-09-15)

     YYYY-MM and  YYYY-MM  : will produce the browses for a period up to the monthly or seasonal scale (Ex :2007-09 2007-12)

     YYYY and YYYY  : will produce the browses on an annual basis (Ex : 2006 2008)

or only <date>

     YYYY-MM-DD  : will produce the browses for the day specified (Ex: 2008-05-12)

     YYYY-MM  : will produce the browses for the month specified (Ex: 2008-05)

     YYYY   : will produce the browses for the year specified (Ex : 2008)

Options :

-s Subsetting's option :
     <-s row_min row_max col_min col_max> to select an interest area.

-t Time's option :
     <-t HHMM HHMM> to select a period, only for input files SEVIRI
     It is possible to choose a period of the day as the following example 2009-09-01 2009-09-10 -t 1000 1200
     For each day, between 10h00 and 12h00 only files are read to calculate the statistics

-m Maximum value's option :
     <-m 250> to choose the maximum value for the average image (not for SEVIRI)

-n Minimum value's option :
     <-n 50> to choose the minimum value for the average image (not for SEVIRI)

-l < Fixed_Value :
    <-l name of fixed value> shows the fixed values and speeds up the computation time, example: space and land values for SEVIRI
    ex : -l LAND_VAL,SPACE_VAL. It's different of fill value

-g Hdf file compression :
     <-g> Use this option to disable compression

-e Print program's informations :
      <-e> Use this option to print program's informations

-k Additional statistics (standard deviation, min max per pixel:
     <-k> Use this option to obtain additional statistics

-y Provides the statistical results to png file :
     <-y> Use this option to execute os.system() and obtain the results to png file

-p Step's option
     <-p> allows to choose the step of list of files
It is also possible to calculate the statistics from a list of HDF files hdf and specifying the data to be read with the options. The program to use is Average_processor.py and the options are explained with this command line :
python Average_processor.py -h
An example, to use this program, will produce the results between 06h and 06h30 for the 2008-01-01 for the variable Aerosol_Optical_Depth product SEVIRI_AER_OC:
python Average_processor.py -d Aerosol_Optical_Depth SEVIRI_AER_OC_20080101.0600.hdf SEVIRI_AER_OC_20080101.0615.hdf SEVIRI_AER_OC_20080101.0630.hdf
Example
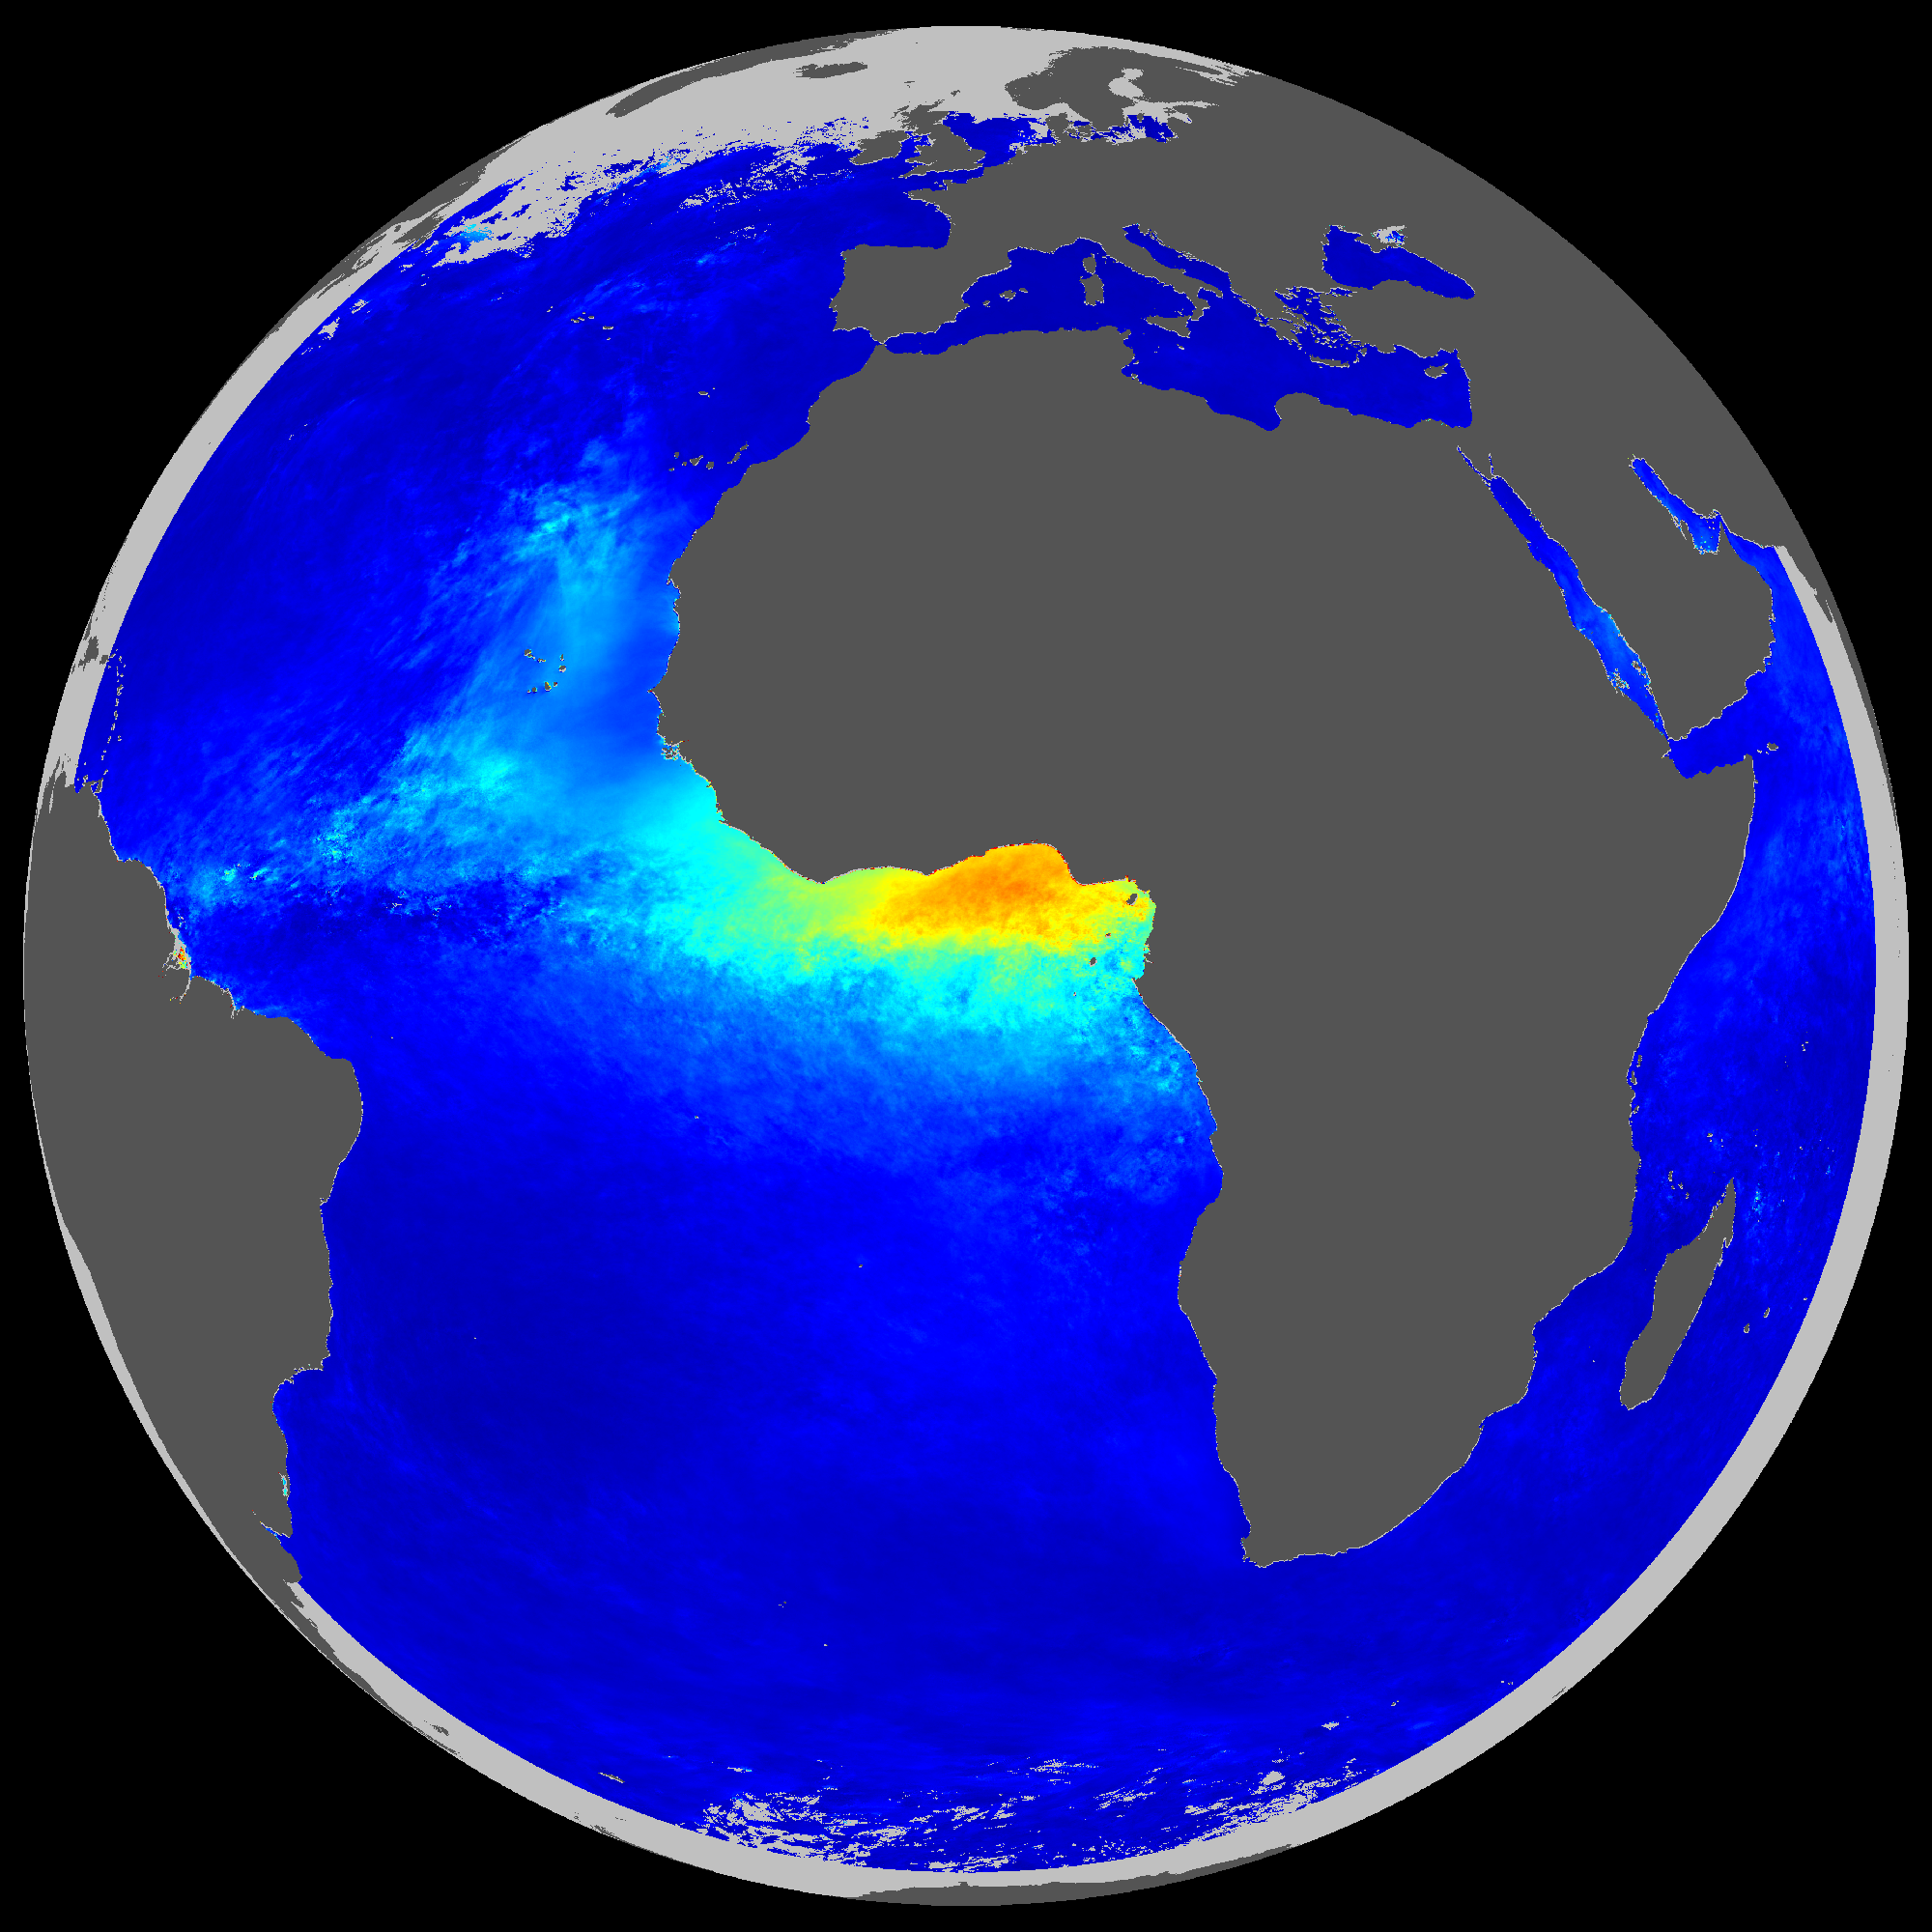
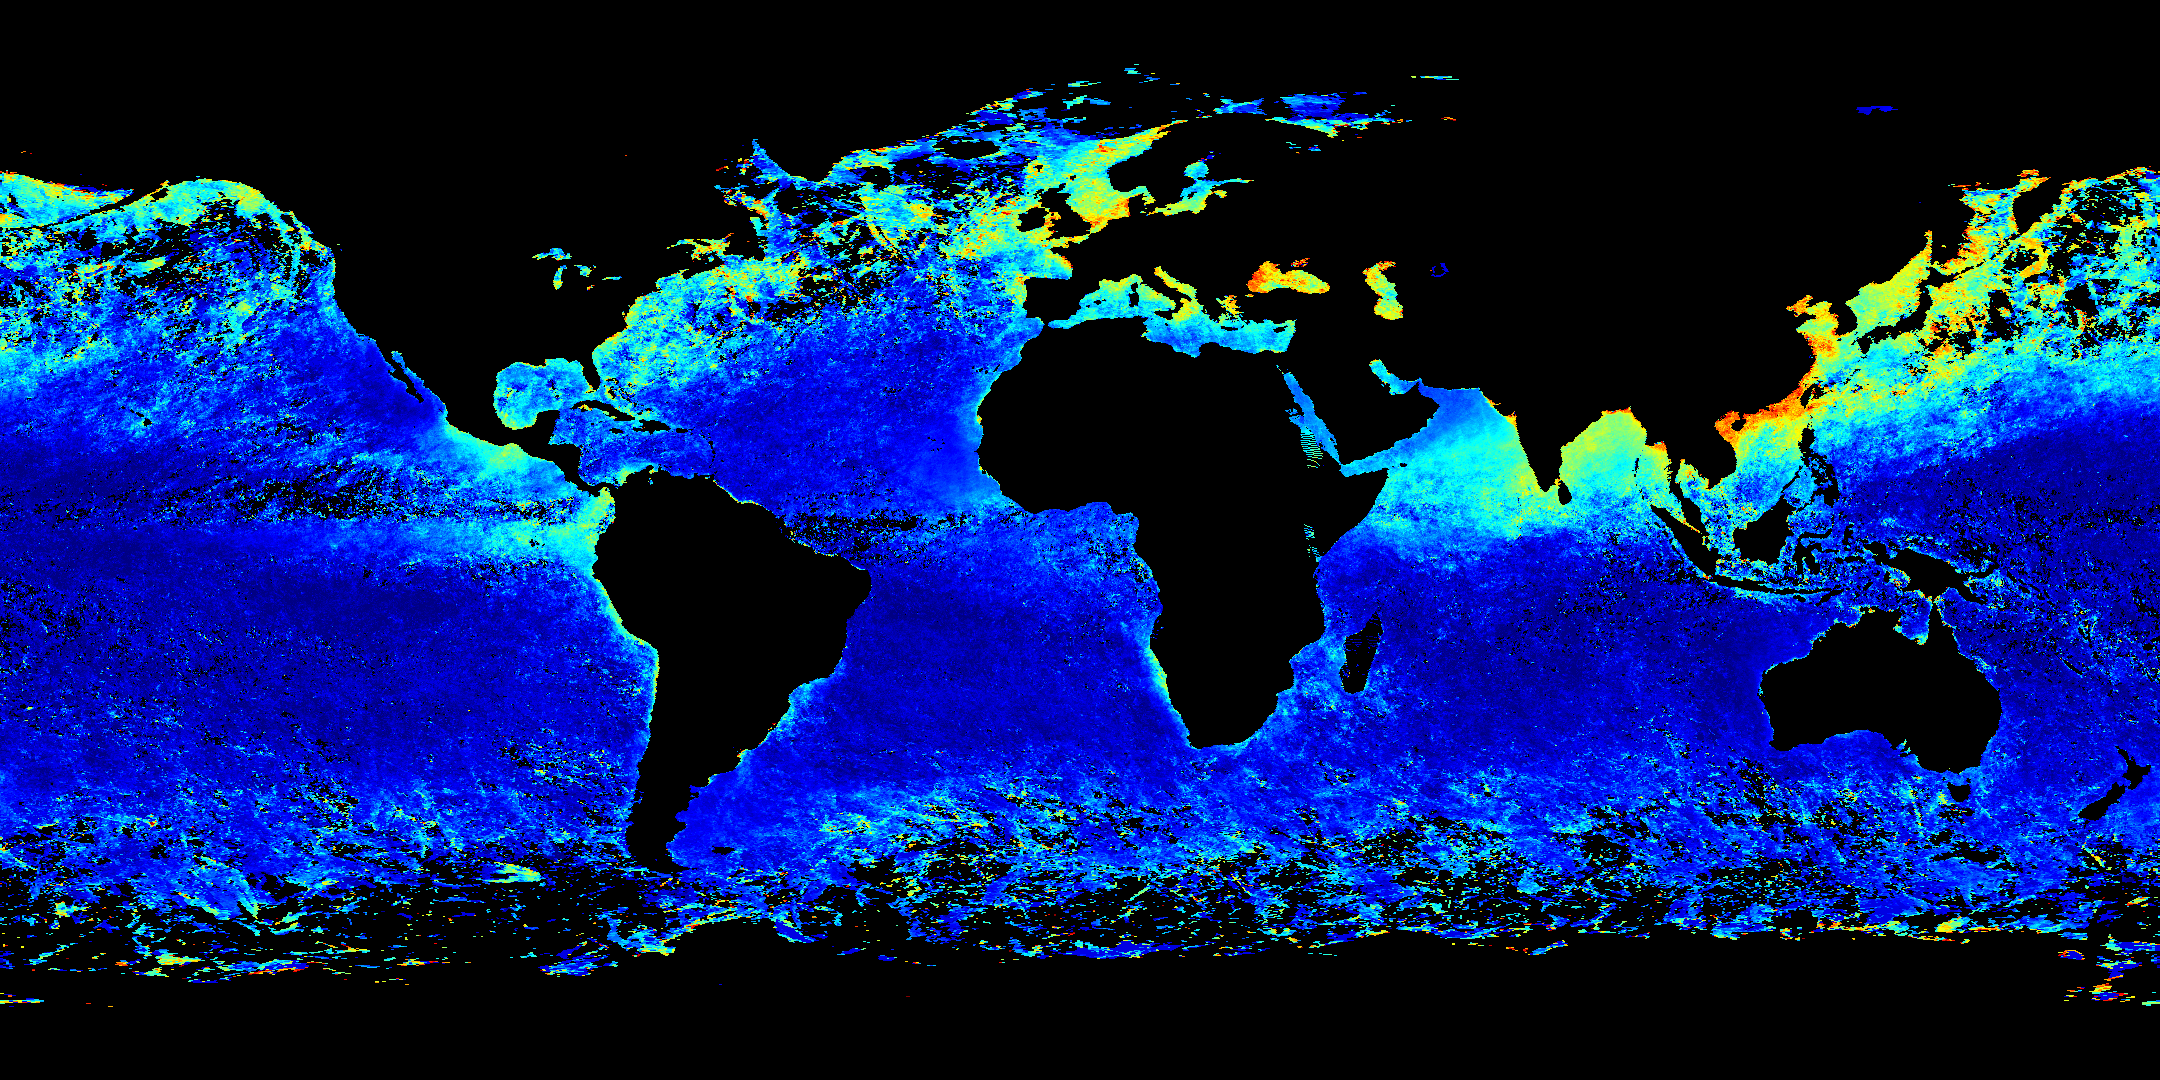
- ligne de commande : python Average_tools.py SEVIRI SEVIRI_AER_OC Aerosol_Optical_Depth 2008-01
- Variable SEVIRI_AER_OC : Aerosol_Optical_Depth
- Referencement : ATM_TAU
- Physical range = [0, 2]
- Date : 01 Jan 2008 au 31 Jan 2008
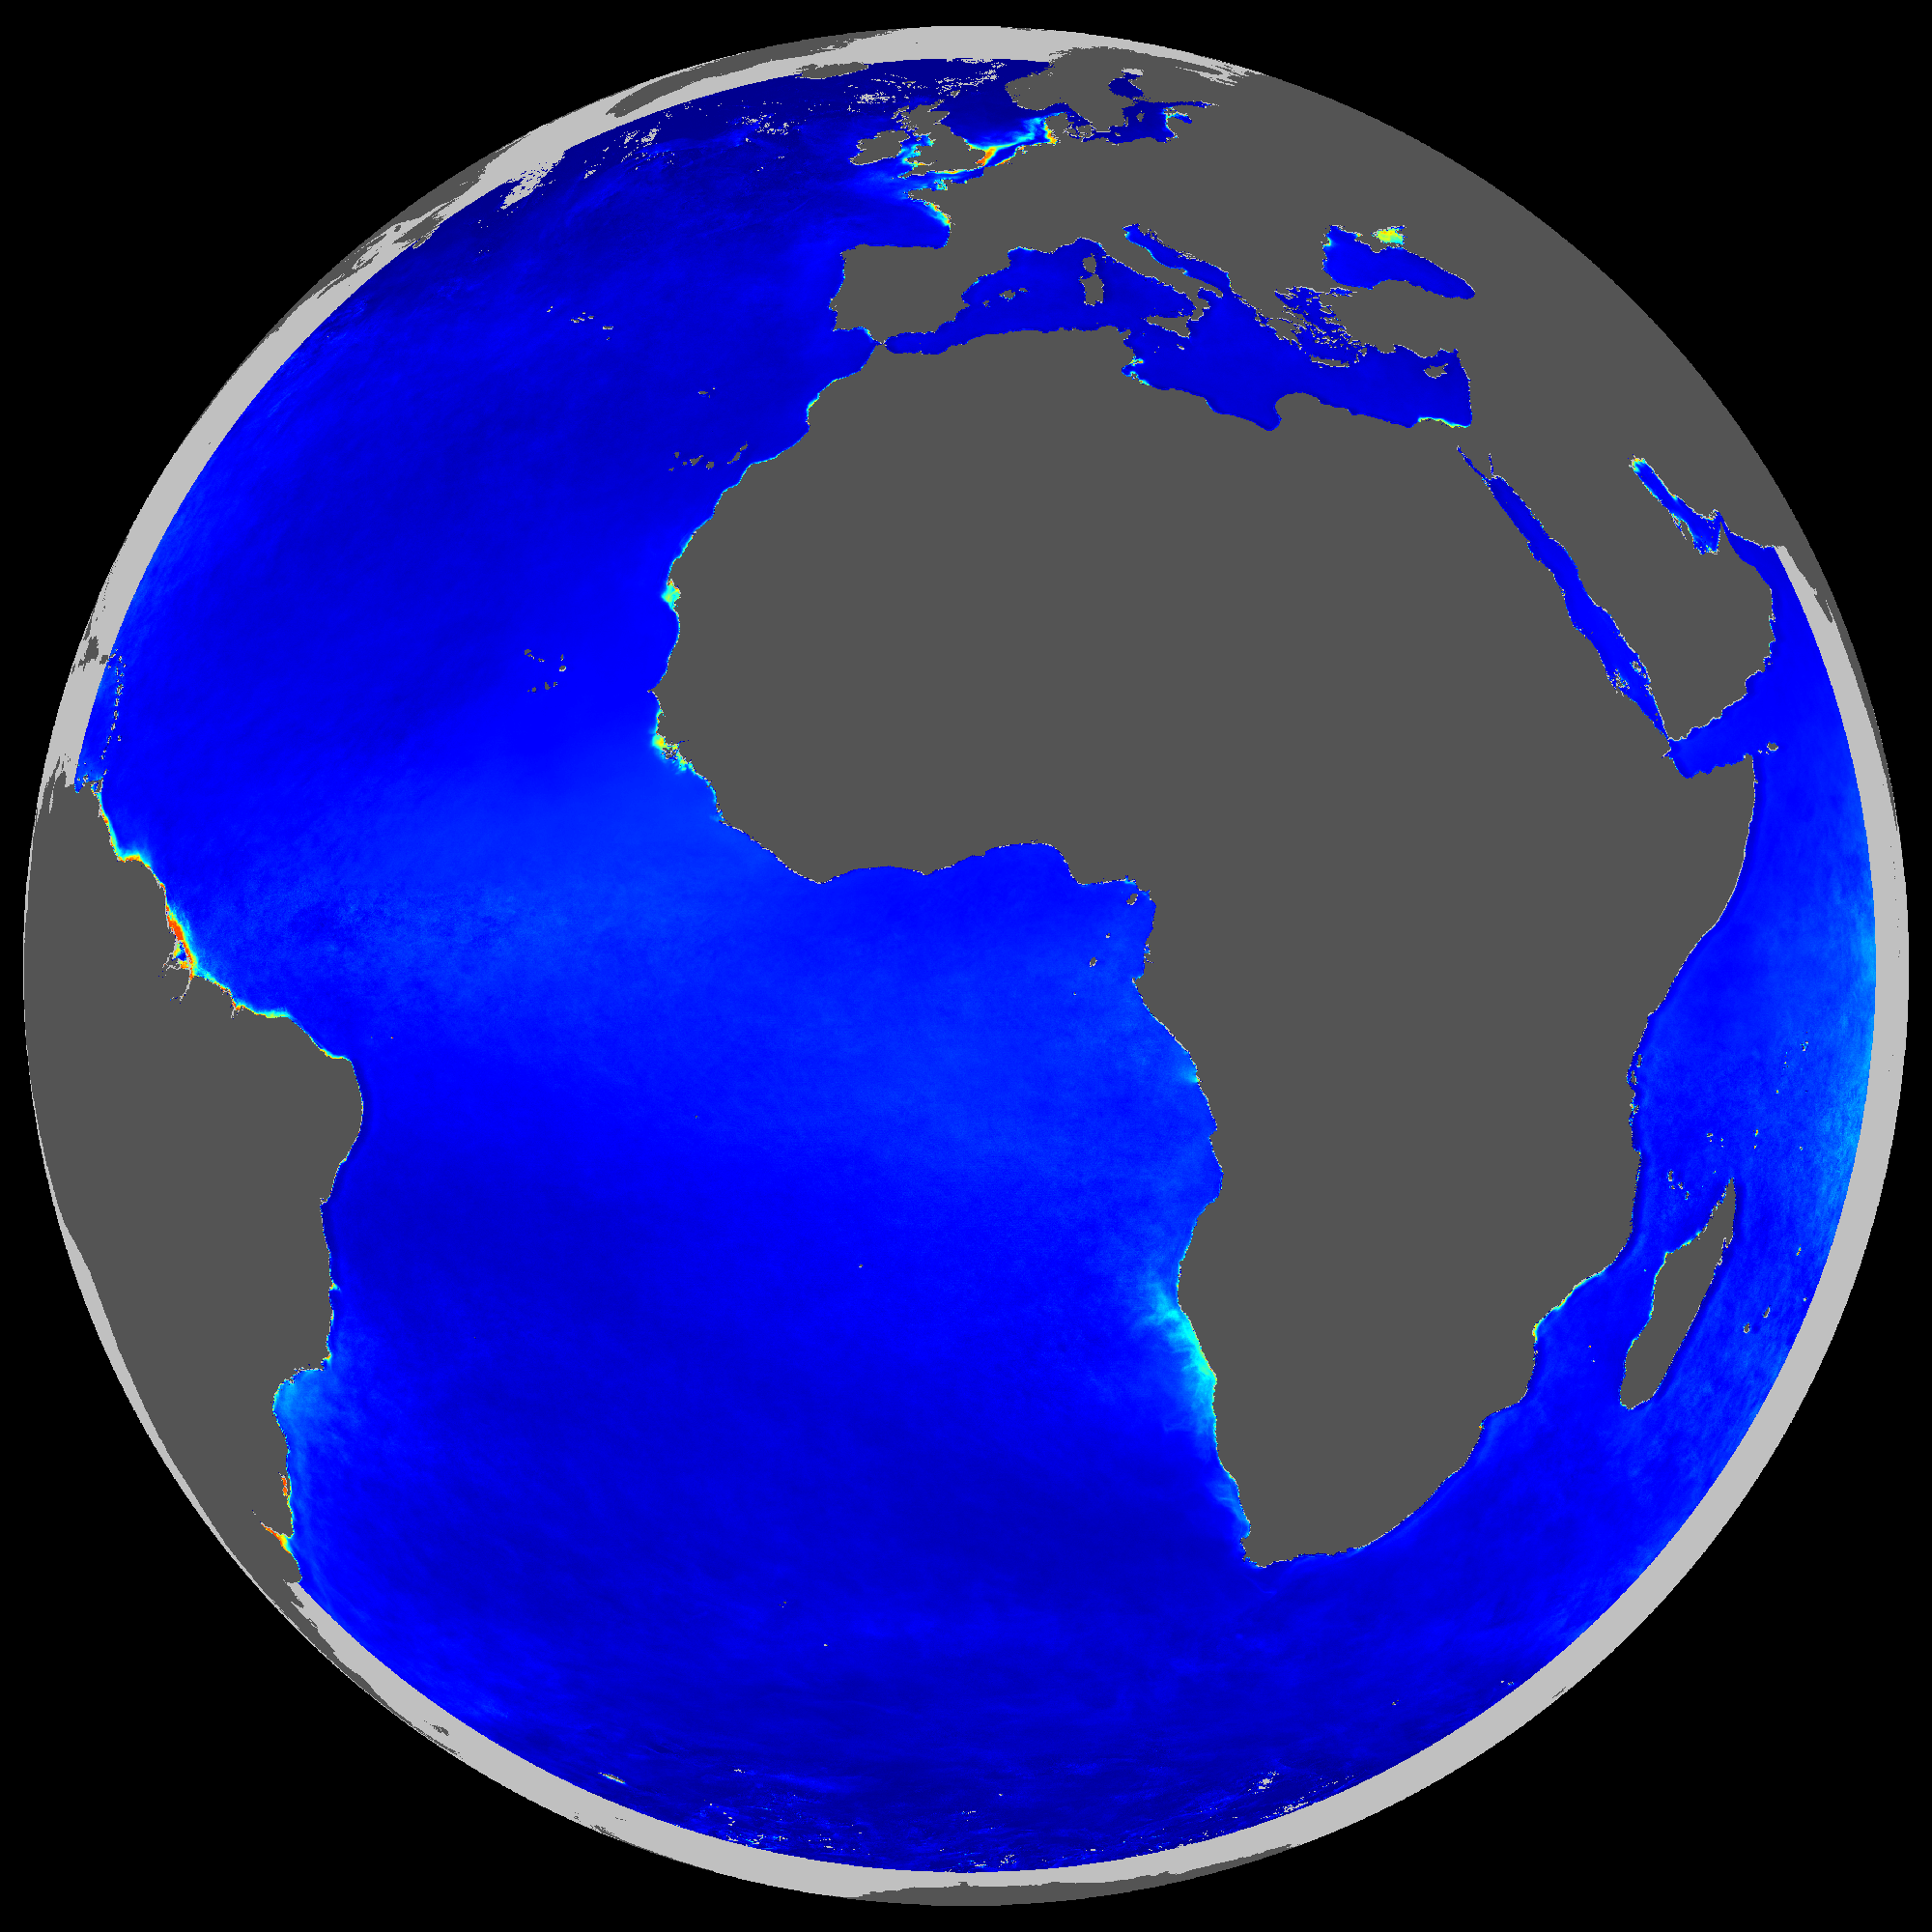
- ligne de commande : python Average_tools.py SEVIRI SEVIRI_AER_OC Angstrom_Exponent 2008-01
- Variable SEVIRI_AER_OC : Angstrom_Exponent
- Physical range = [0, 3]
- Date : 01 Jan 2008 au 31 Jan 2008
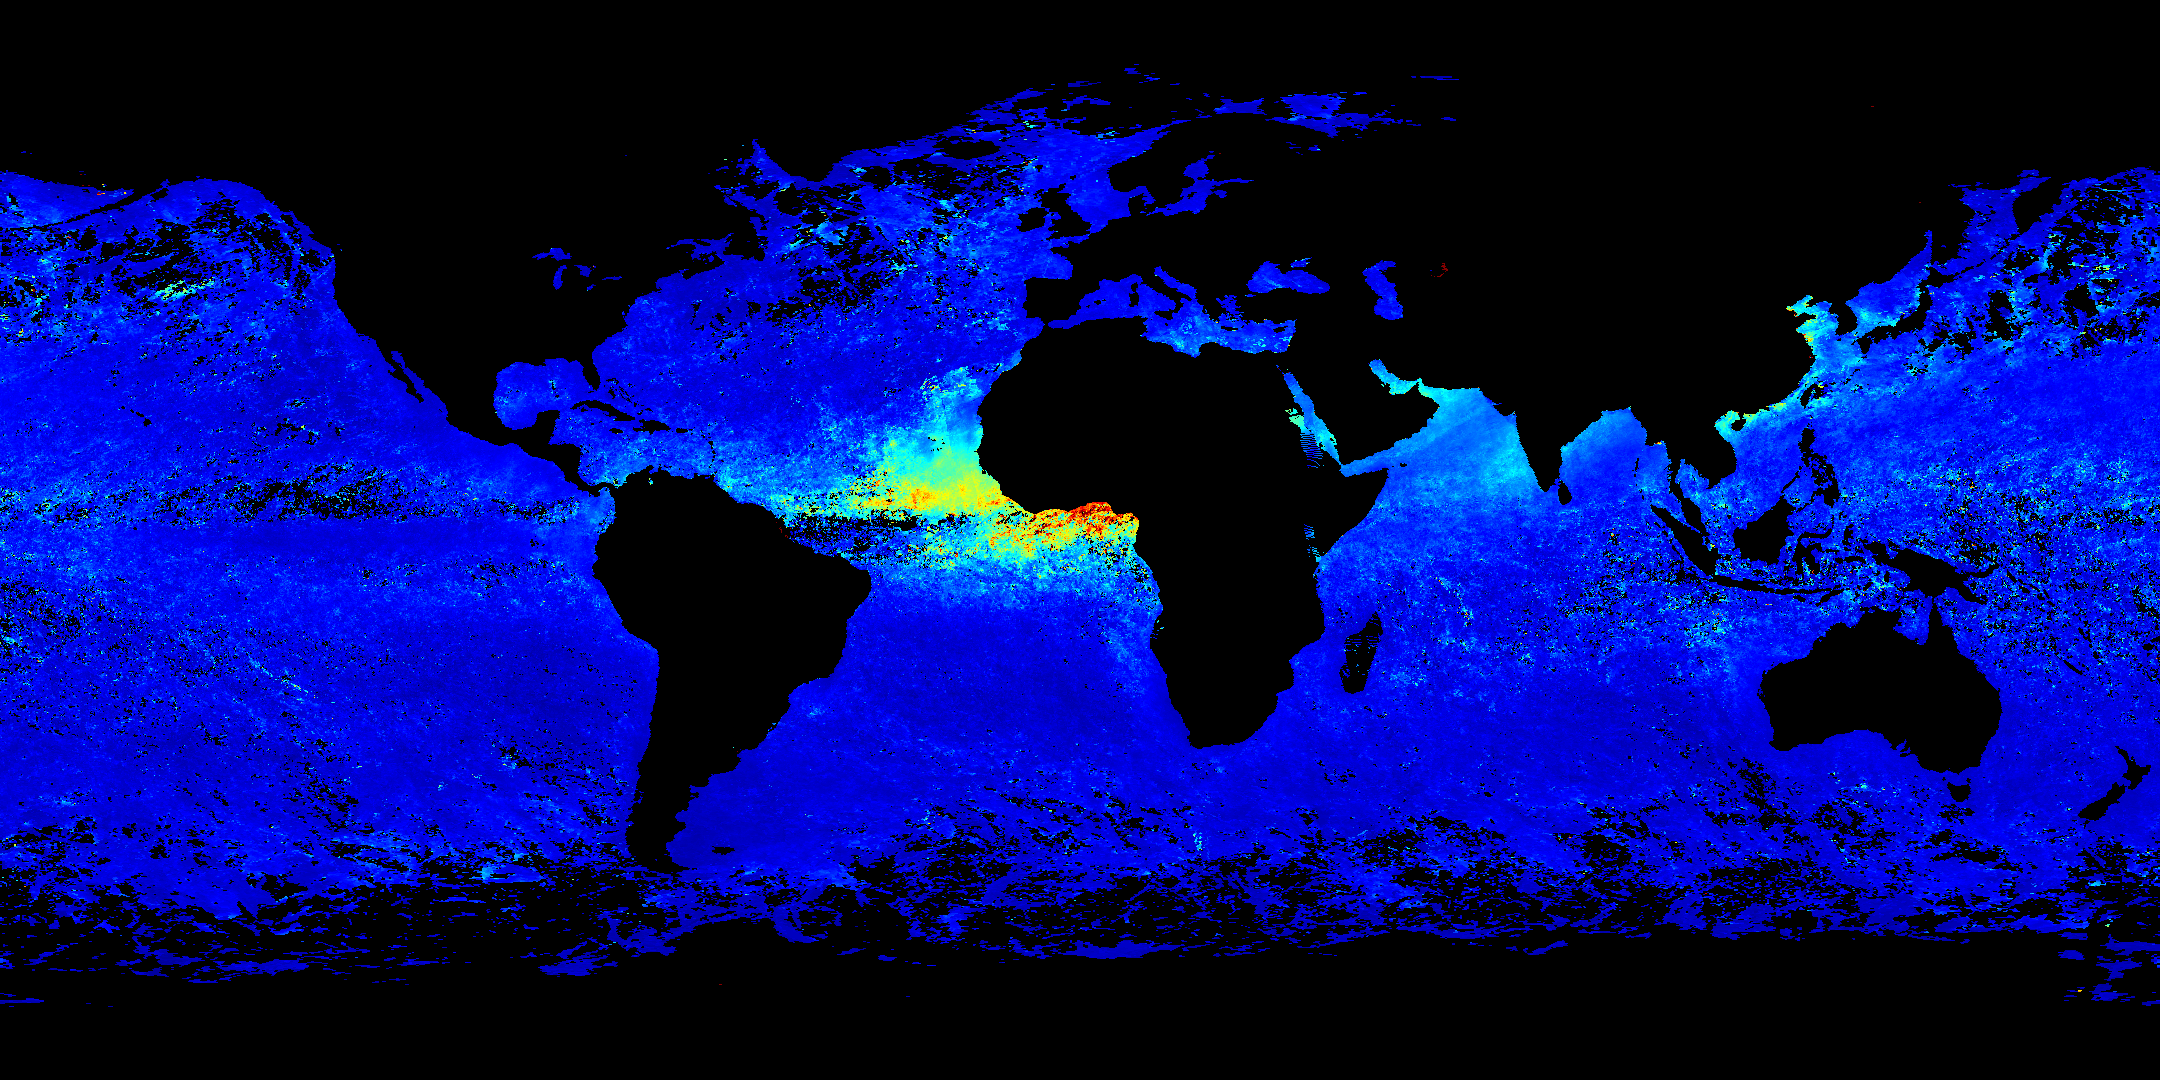
- ligne de commande : python Average_tools.py PARASOL PR_ATM ATM_TAUA_D_ 2007-02-15 2007-04-08
- Variable PR_ATM : Aerosol Optical Thickness at 865 nm
- Referencement : ATM_TAUA
- Physical range = [0, 1]
- Date : 15 Fev 2007 au 8 April 2007
- ligne de commande : python Average_processor.py ATM_ANG_D_0702.hdf ATM_ANG_D_0703.hdf ATM_ANG_D_0704.hdf -b 2007-02-15 -c 2007-04-08
- Variable PR_ATM : Angstrom Coefficient
- Referencement : ATM_ANG
- Physical range = [0, 2]
- Periode : 15 Fev 2007 au 8 April 2007
Prerequisites
To use programs, libraries are necessary, PyHdf to read data recorded in HDF4, Numpy and the package hdf2img (a command line tool and a python module that reads the datas of an SDS and save it to an image).
Download
Sources can be downloaded here :
Package can be browsed here :
Copyright
Copyright (C) 2010 Icare – ICARE web site
Nicolas THOMAS, nicolas.thomas@icare.univ-lille.fr
This program is a free software; you can redistribute it and/or modify it under the terms of the CeCILL Public License as published by www.cecill.info (License version 2 or later).
This program is distributed in the hope that it will be useful, but WITHOUT ANY WARRANTY; without even the implied warranty of MERCHANTABILITY or FITNESS FOR A PARTICULAR PURPOSE. See the CeCILL Public License for more details.
You should have received a copy of the CeCILL Public License along with this program; if not, please contact www.cecill.info
For any questions or concerns regarding this program, or general information about the ICARE Project, please email to contact@icare.univ-lille.fr