
How to convert a matplotlib figure to a numpy array or a PIL image
Description
For manipulating a figure build with matplotlib, it is sometimes requested to convert it in a format understandable by other python libraries. This can be useful for using scipy image filters or manually adding annotations for example.Prerequisites
Language- PYTHON >=2.5
- matplotlib >=0.99.0
- numpy >=1.2.1
- PIL (Python Imaging Library) >=0.1.6
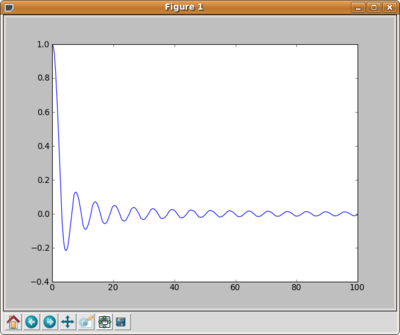
import matplotlib.pyplot
import numpy

# Generate a figure with matplotlib</font>
figure = matplotlib.pyplot.figure(  )
plot   = figure.add_subplot ( 111 )

# draw a cardinal sine plot
x = numpy.arange ( 0, 100, 0.1 )
y = numpy.sin ( x ) / x
plot.plot ( x, y )
matplotlib.pyplot.show()
1D Plot of a Cardinal Sine, with frame decorations
REM If you obtain an message like :
.../python2.5/lib/python2.5/site-packages/matplotlib/backends/__init__.py:41: UserWarning:
Your currently selected backend, 'agg' does not support show().
Please select a GUI backend in your matplotlibrc file
matplotlib.pyplot.savefig ( "./my_img.png" )
import numpy

def fig2data ( fig ):
    """
    @brief Convert a Matplotlib figure to a 4D numpy array with RGBA channels and return it
    @param fig a matplotlib figure
    @return a numpy 3D array of RGBA values
    """
    # draw the renderer
    fig.canvas.draw ( )

    # Get the RGBA buffer from the figure
    w,h = fig.canvas.get_width_height()
    buf = numpy.fromstring ( fig.canvas.tostring_argb(), dtype=numpy.uint8 )
    buf.shape = ( w, h,4 )

    # canvas.tostring_argb give pixmap in ARGB mode. Roll the ALPHA channel to have it in RGBA mode
    buf = numpy.roll ( buf, 3, axis = 2 )
    return buf
import Image

def fig2img ( fig ):
    """
    @brief Convert a Matplotlib figure to a PIL Image in RGBA format and return it
    @param fig a matplotlib figure
    @return a Python Imaging Library ( PIL ) image
    """
    # put the figure pixmap into a numpy array
    buf = fig2data ( fig )
    w, h, d = buf.shape
    return Image.fromstring( "RGBA", ( w ,h ), buf.tostring( ) )
im = fig2img ( figure )
im.show()