Canadian wildfires smoke crosses the atlantic ocean – June 2025


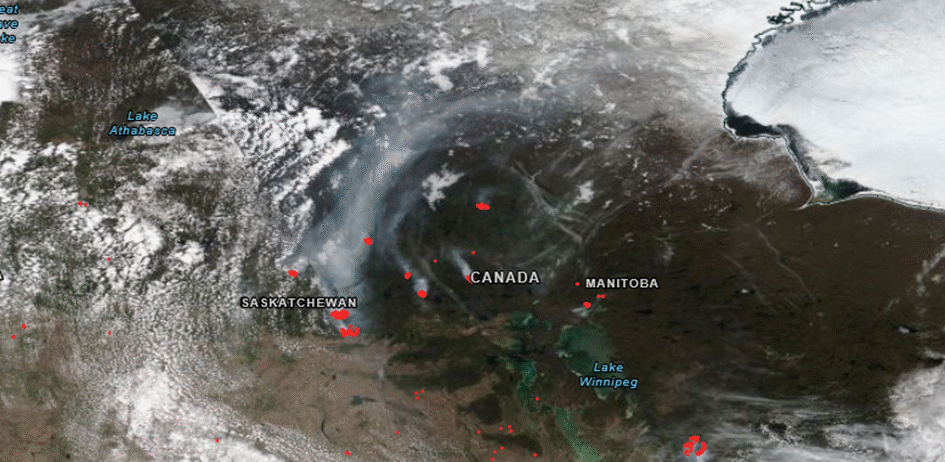
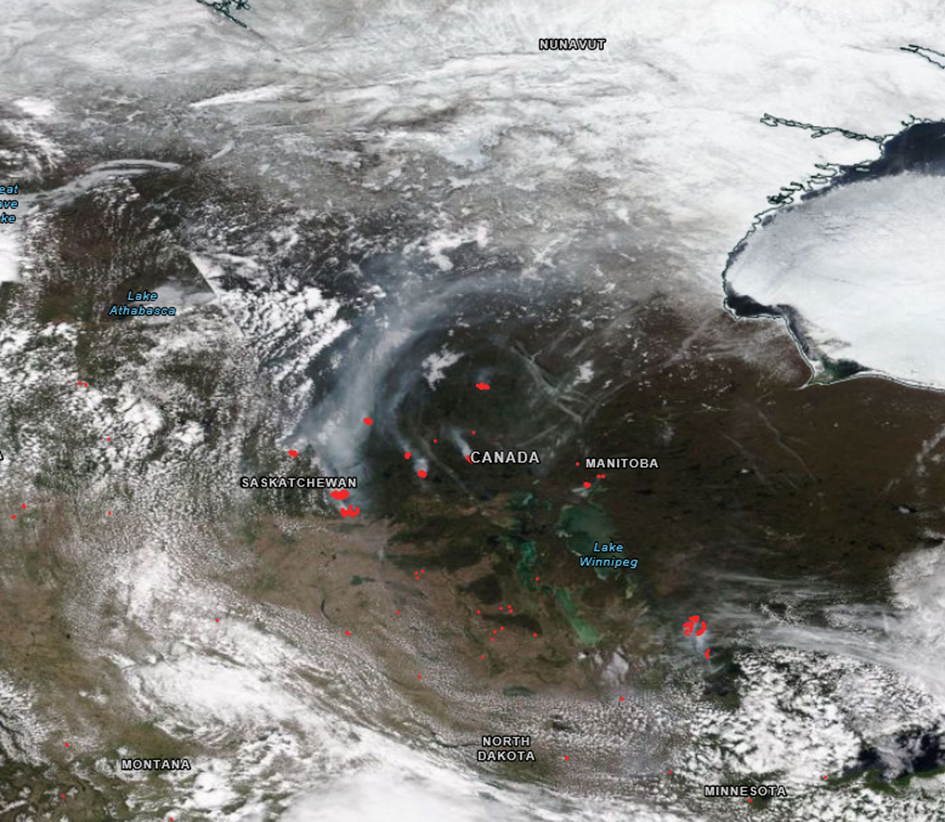
As every year, Canada is affected by massive forest fires. In 2025, they began in late May in the Saskatchewan region, as seen in the illustration below. The red dots are fire detections, and the smoke plumes are bluish-white trails. This image is taken from a low earth orbit satellite at an altitude of about 800 km.
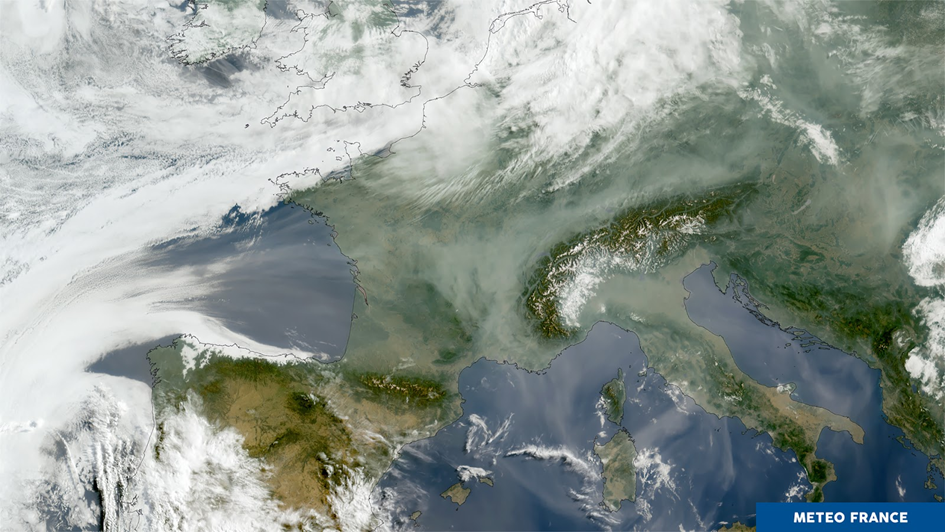
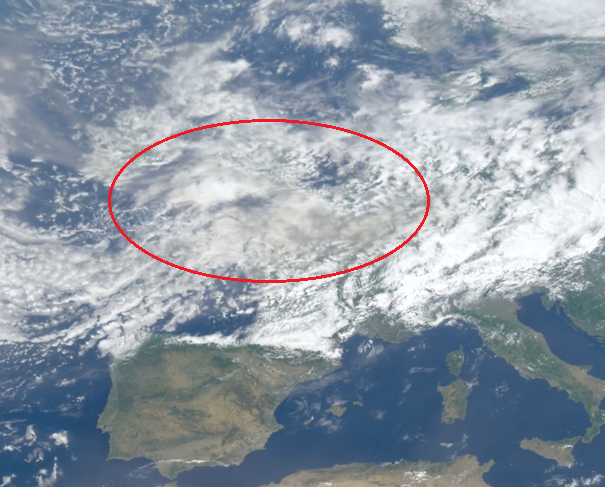
These plumes were carried through the atmosphere until they reached Europe two weeks later, as can be seen in the image below.
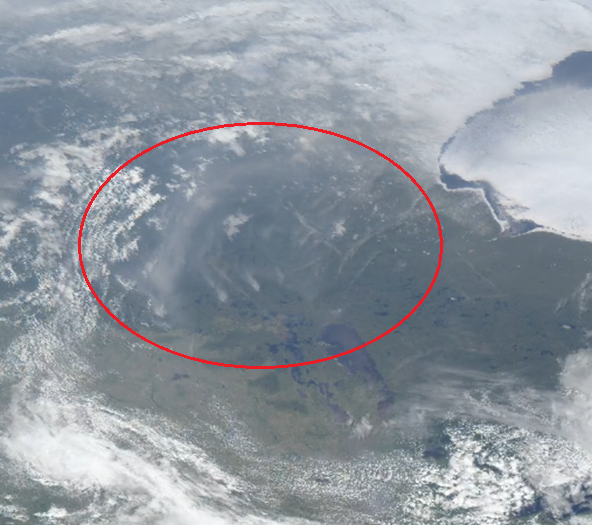
The transport of the smoke over the Atlantic ocean from Canada to Europe can be observed using the GEORING product generated by the AERIS/ICARE data and services center, which combines data from 5 geostationary satellites and provides a global image approximately every 30 minutes.
Thus, on May 24 at 18:00 UTC, the same plume as observed by a satellite moving in the first illustration, but by a geostationary satellite, much higher, at an altitude of about 36,000 km.
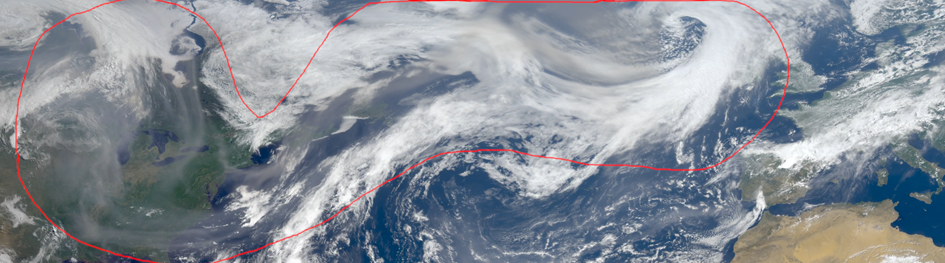
Using the animation below, one can follow the transport of the plume across the Atlantic Ocean over 15 days.
The high-resolution video is available for download here.
Complementary analysis of airborne and in-situ measurements over France for this period was conducted and is available on the ACTRIS-FR Research Infrastructure website.
Comme chaque année, le Canada est touché par de gigantesques feux de forêt. En 2025, ils ont débutés fin mai dans la région du Saskatchewan comme on peut le voir dans l’illustration ci-dessous. Les points rouges sont les détections de foyers d’incendies et les panaches de fumées les trainées d’un blanc bleuté. Cette image est d’un satellite défilant en orbite basse à environ 800 km d’altitude.
Ces panaches ont été transportés dans l’atmosphère jusqu’à atteindre l’Europe deux semaines plus tard comme on peut le voir sur l’image ci-dessous.
Ce phénomène de transport peut être observé sur plusieurs à l’aide du produit GEORING généré par le centre de données et services AERIS/ICARE, qui combine les images de 5 satellites géostationnaires et permet d’avoir une image globale toutes les 30 minutes environ.
Ainsi, le 24 mai à 18:00 UTC, le même panache qu’observé par un satellite défilant sur la première illustration, mais par un satellite géostationnaire, beaucoup plus haut, à une altitude d’approximativement 36 000 km.
Grâce à l’animation ci-dessous, on peut suivre le transport du panache à travers l’océan atlantique sur 15 jours.
La vidéo en haute résolution est téléchargeable ici.
Une analyse complémentaire des mesures aéroportées et observées in-situ sur la France pour cette période a été conduite et est disponible sur le site de l’Infrastructure de Recherche ACTRIS-FR.