Display 1D data with Python

Description

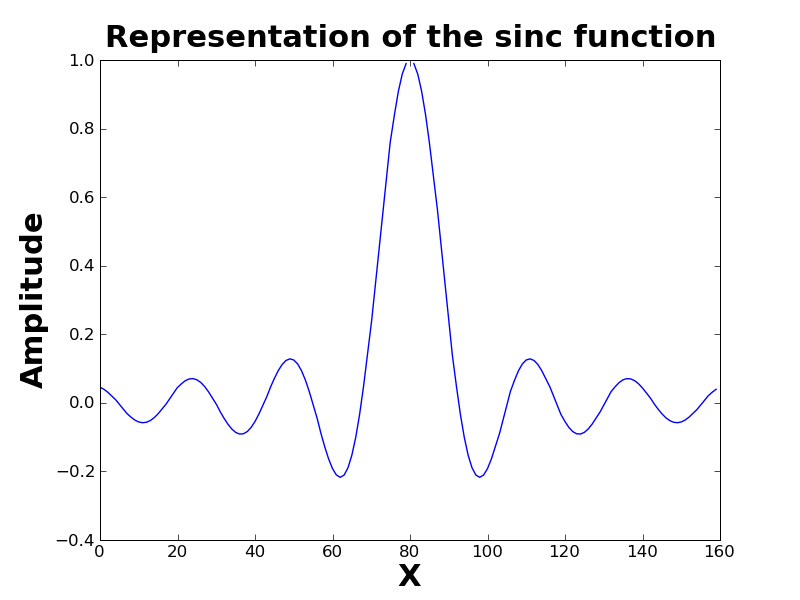
This page details an example for plotting a graph with Python and the Matplotlib library. In this particular case, the data are read from an HDF4 file, but it can also be read from any source as long as the data are passed to Matplotlib in a numpy array.

Prerequisites

Language
  • Python
Libraries
  • pyhdf
  • matplotlib
  • numpy

Input File

The data file used in the example below is : sinus_cardinal_1D.hdf

Output Image


The program creates the image

Source Code

from pylab    import *
from numpy    import *
from pyhdf.SD import *
 
# Path to the file
fileName = "sinus_cardinal_1D.hdf"
 
# Open HDF file for reading
filehdf = SD ( fileName )
 
# Reading attributes
print "file : ", fileName
 
# Read the SDS data
sds = filehdf.select ( 0 ).get ( )
 
# Display image
plot ( sds )
 
# Image title
title ( "Representation of the sinc function", weight = "bold", size = 22 )
 
# Axes title
ylabel ( "Amplitude", weight = "bold", size = 22 )
xlabel ( "X",         weight = "bold", size = 22 )
 
# Save the current figure to output image
savefig( "./sinus_cardinal_1D.png" )
 
# eventually display it
show()
 
# Close access to the HDF file
filehdf.end()


More news

Tutorials

Reading a NetCDF file with Python, Matlab and R

Language/Format: MATLAB
Description: This page gives pieces of code to read data in a NetCDF file
Author(s): Aminata NDIAYE (ICARE)

10.10.2024

Highlights

AERIS/ICARE was migrated his good old FTP server to SFTP

For security reason, we are abandoning the FTP protocol in favor of SFTP on our distribution server. Depending of the way you are using this service, you can have to change the commands you are used to. Note that not all applications support the SFTP protocol, and some additional tools may need to be installed […]

01.03.2024

Tutorials

How to convert a matplotlib figure to a numpy array or a PIL image

Language/Format: Python
Description: For manipulating a figure build with matplotlib, it is sometimes requested to convert it in a format understandable by other python libraries. This can be useful for using scipy image filters or manually adding annotations for example.
This page details how to convert a matplotlib figure to a numpy 3D array of RGBA values, or directly to a PIL ( Python Imaging Library ) Image.
Author(s): Nicolas Pascal (ICARE)

10.02.2017

Search