Privacy Overview
This website uses cookies to improve your experience while you navigate through the website. Out of these cookies, the cookies that are categorized as necessary are stored on your browser as they are essential for the working of basic functionalities of the website. We also use third-party cookies that help us analyze and understand how you use this website. These cookies will be stored in your browser only with your consent. You also have the option to opt-out of these cookies. But opting out of some of these cookies may have an effect on your browsing experience.
Always Active

Necessary cookies are required to enable the basic features of this site, such as providing secure log-in or adjusting your consent preferences. These cookies do not store any personally identifiable data.

No cookies to display.

Functional cookies help perform certain functionalities like sharing the content of the website on social media platforms, collecting feedback, and other third-party features.

No cookies to display.

Analytical cookies are used to understand how visitors interact with the website. These cookies help provide information on metrics such as the number of visitors, bounce rate, traffic source, etc.

No cookies to display.

Performance cookies are used to understand and analyze the key performance indexes of the website which helps in delivering a better user experience for the visitors.

No cookies to display.

Advertisement cookies are used to provide visitors with customized advertisements based on the pages you visited previously and to analyze the effectiveness of the ad campaigns.

No cookies to display.

Display 2D data with Python

Description

This page gives an example for creating an image from a 2D data array with Python and the Matplotlib library. In this particular case, the data are read from an HDF4 file, but it can also be read from any source as long as the data are passed to Matplotlib in a numpy array.

Prerequisites

Language
  • Python
Libraries
  • pyhdf
  • matplotlib
  • numpy

Input File

The data file used in the example below is : Cardinal_sine_2D.hdf
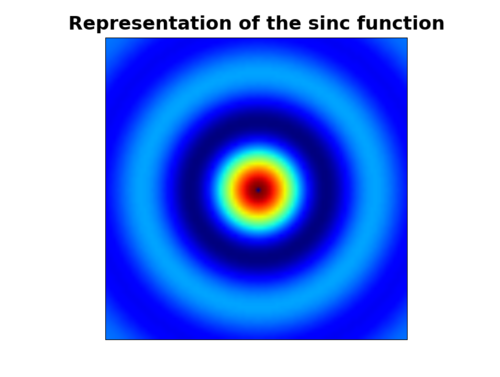
Output Image

The program creates the image Representation (2D) of the sinc function

Source Code

from pylab import *
from numpy import *
from pyhdf.SD import *
 
# Path to the file
fileName = "Cardinal_sine_2D.hdf"
 
# Open HDF file for reading
filehdf = SD ( fileName )
 
# Reading attributes
print "file : ", fileName
 
# Read the sds data
sds = filehdf.select ( 0 ).get ( )
 
# Display image
imshow ( sds )
 
# Image title
title ( "Representation of the sinc function", weight = "bold", size = 22 )
 
xticks([])
yticks([])
 
# Save the current figure
savefig ( "Cardinal_sine_2D.png" )
show()
 
# Terminate access to the file
filehdf.end()


More news

Tutorials

Reading a NetCDF file with Python, Matlab and R

Language/Format: MATLAB
Description: This page gives pieces of code to read data in a NetCDF file
Author(s): Aminata NDIAYE (ICARE)

10.10.2024

Highlights

AERIS/ICARE was migrated his good old FTP server to SFTP

For security reason, we are abandoning the FTP protocol in favor of SFTP on our distribution server. Depending of the way you are using this service, you can have to change the commands you are used to. Note that not all applications support the SFTP protocol, and some additional tools may need to be installed […]

01.03.2024

Tutorials

How to convert a matplotlib figure to a numpy array or a PIL image

Language/Format: Python
Description: For manipulating a figure build with matplotlib, it is sometimes requested to convert it in a format understandable by other python libraries. This can be useful for using scipy image filters or manually adding annotations for example.
This page details how to convert a matplotlib figure to a numpy 3D array of RGBA values, or directly to a PIL ( Python Imaging Library ) Image.
Author(s): Nicolas Pascal (ICARE)

10.02.2017

Search